
Aust J Crop Sci. 18(09):580-590 (2024)
ISSN:1835-2707
https://doi.org/10.21475/ajcs.24.18.09.p144
Transient salinity stress promotes secondary metabolites and antioxidant enzymes in Brassica plants
Vu Phong Lam2,3†, Jiwon Bae1†, Seunghwan Hong1, Jongseok Park1,2*
1Department of Bio-AI Convergence, Chungnam National University, Daejeon 34134, Korea
2Department of Horticultural Science, Chungnam National University, Daejeon 34134, Korea
3Department of Agronomy, Tay Bac University, Son La 360000, Vietnam
†These authors contributed equally to this work
Abstract
This study investigated salinity stress time-dependent responses of pak choi (Brassica campestris L.), arugula (Eruca sativa Mill.), and red frill (Brassica juncea L.), focusing on growth parameters, secondary metabolites, and antioxidant activities. Salinity stress (NaCl) solution with electrical conductivity (EC) of 12.6 dS∙m⁻¹ was introduced to the rhizosphere at the specific time: from 2:00 pm on day 6 to 2:00 pm on day 7 (1st week (W)), 2:00 pm on day 13 to 2:00 pm on day 14 (2nd W), and 2:00 pm on day 20 to 2:00 pm on day 21 (3rd W). Plant growth parameters were assessed at 1, 2, and 3 weeks after transplantation (WAT), showing detailed changes over time. Pak choi exhibited a significant increase in biomass at 2nd W, whereas arugula and red frill showed no marked differential reactions. Glucosinolates (GLS), phenolic compounds, and antioxidant activities were analyzed at 2 and 3 WAT. Maximum GLS concentrations in pak choi and arugula plants occurred in the 3rd W under 3 WAT. Phenolic concentrations in the arugula peaked under the 2nd W treatment. Regarding pak choi, the 1st W treatment at 3 WAT and 2nd W treatment at 2 WAT exhibited maximum DPPH scavenging activity and peroxidase (POD). The 2nd W treatment at 2 WAT indicated the highest total phenol concentration and POD activity in arugula. Red frill exhibited significantly elevated total glucosinolate concentrations under salinity conditions at 3rd W. This analysis reveals how salinity stress affects growth and biochemical responses in these vegetables, offering insights for optimizing cultivation under saline conditions.
Keywords: Antioxidant, brassicaceae, glucosinolate, salinity stress, plant growth parameters
Abbreviations: week after transplantation (WAT), electrical conductivity (EC), glucosinolates (GLS), 2,2-diphenyl-1-picrylhydrazyl (DPPH), peroxidase (POD), superoxide dismutase (SOD), shoot dry weight (SDW), root fresh weight (RFW), progoitrin (PG), sinigrin (SIN), 4-hydroxyglucobrassicin (4OH), glucobrassicanapin (GB), 4-methoxyglucobrassicin (4M), gluconasturtiin (GNI), gallic acid (GA), chlorogenic acid (CGA), 4-hydroxybenzoic acid (4HB), caffeic acid (CA), (-)-epicatechin ((-)-Ep), trans-ferulic acid (TFA), benzoic acid (BA), rutin (Ru), trans-cinnamic acid (TCA), Korea Horticulture Experiment (KHE), sodium chloride (NaCl), and high-performance liquid chromatography (HPLC).
Introduction
Brassica oleracea is a pivotal vegetable species cultivated globally. This species encompasses various subspecies and exhibits significant variations in both appearance and phytochemical composition (Soengas et al., 2021). Cruciferous vegetables belonging to family Brassicaceae have been cultivated and consumed by diverse cultures since ancient times. Recently, Brassica vegetables have garnered recognition as functional foods owing to the presence of specialized metabolites or phytochemicals whose bioactivity is associated with positive effects on human health (Samec et al., 2018). Brassica plants are widely distributed worldwide and possess nutritionally important components such as phenolic compounds, vitamins, fiber, soluble sugars, minerals, fats, and carotenoids (Cartea et al., 2011; Velasco et al., 2011). Glucosinolate (GLS) is a compound rich in nitrogen and sulfur that is prominently present in Brassica plants. It is known for its diverse health effects and functionalities (Miao et al., 2021). GLS is known for its role in cancer prevention and antioxidant activity. GLS hydrolysis products, specifically isothiocyanates, exhibit notable anti-inflammatory, antioxidant, anticancer, and antimicrobial properties. Studies have demonstrated their ability to impede cancer cell growth and stimulate apoptosis (Connolly et al., 2021; Melim et al., 2022). GLS plays a crucial role in fortifying defense mechanisms against pests and pathogens and serves as a component of the plant response to both biotic and abiotic stresses (Chhajed et al., 2020). Genetic factors primarily dictate GLS type, and their concentrations are significantly affected by environmental factors (Ishida et al., 2014; Jasper et al., 2020). Brassica plants serve as natural antioxidant reservoirs, encompassing various pigments, phenolic acids, and flavonoids (Podsedek, 2007). Not only do they serve as vital natural antioxidant sources, they may also enhance human health owing to the diverse array of minerals, dietary fibers, and vitamins they contain (Samec et al., 2018).
Numerous studies have investigated salinity as a eustressor, revealing favorable results in terms of physical properties, phenolic, flavor, and bioactive compounds, and anti-nutrient modulation following salt application (Rouphael et al., 2018a; Sarker and Oba, 2018). Elevated salinity levels have been observed to adversely affect Brassica crops, leading to a diminished photosynthetic system capacity and an overall yield decrease. This environmental stressor also induces alterations in hormonal parameters. However, under these conditions, there was a notable increase in the phytochemical content of crops (Linic et al., 2019; Pavlovic et al., 2019). Changes in phytochemical content are species-specific and contingent on the concentration of the applied salt. Under moderate salinity conditions (25–50 mM NaCl), rapeseed germination results in increased phenolic content and antioxidant activity in the sprouts (Falcinelli et al., 2017). Application of 160 mM NaCl to broccoli sprouts notably increased total phenolic compounds, glucoraphanin, sulforaphane, antioxidants, and myrosinase activity levels. Simultaneously, there was a significant reduction in the ascorbic acid content (Guo et al., 2014). Exposure to 100 mM NaCl resulted in increased glucoraphasatin levels, total GLS, and total phenolic content and increased myrosinase activity in radish sprouts (Yuan et al., 2010). Both low (50 mM) and moderate salinity (100 mM) led to a significant increase in total phenolic acid content in kale sprouts. Additionally, total GLS exhibited a dose-dependent increase in all three Brassica species sprouts (kale, white cabbage, and Chinese cabbage) across an applied range of salt concentrations (50–200 mM NaCl) (Sarker and Oba, 2019).
In the future, a key challenge for the research community will be the effective application of eustress, such as salinity, to improve vegetable nutritional and functional qualities without sacrificing their yield. However, the molecular and physiological mechanisms responsible for increased phytochemical production under salinity stress remain poorly understood. Consequently, it is essential to identify crucial factors, including exposure duration, plant growth stage, specific salt source, and salt concentration, to further elucidate these processes (Rouphael et al., 2018b; Samec et al., 2021). While most studies focusing on salinity as a beneficial stressor for augmenting phytochemical content in Brassica species have primarily concentrated on sprouts, it is imperative to recognize the importance of extending this investigation to full grown plants. The manipulation of physical properties, flavor, bioactive compounds, and mitigation of undesirable antinutrients in vegetables should also be acknowledged and studied in the context of salinity exposure in mature plants grown under a hydroponic system. The objective of the current study was to identify the optimal salinity exposure duration that affects total phenol levels, GLS, and antioxidant enzymes without damaging the growth of hydroponically cultivated pak choi (Brassica campestris L.), arugula (Eruca sativa Mill.), and red frill (Brassica juncea L.).
Results
Plant growth parameters
Table 1 and Fig. 3 provides a comprehensive overview of pak choi responses to salinity stress at different time points post-transplantation. At 1 and 2 weeks after transplantation (WAT), there were no significant differences in shoot and root biomass between the control group and the plants subjected to NaCl-induced stress. However, a significant reduction in the shoot/root (S/R) dry weight (DW) ratio was observed at 2 WAT under the 1st W stress conditions compared with that of the control. At 3 WAT, salinity stress significantly affected both shoot and root biomass, leading to alterations in the S/R ratio. Specifically, shoot fresh weight (SFW) exhibited a substantial increase under the 2nd W stress conditions at 3 WAT compared with that of the control. Moreover, SDW, RFW, and RDW increased under the 1st and 2nd W stress conditions at 3 WAT compared to those of the control. Notably, RDW was significantly higher under NaCl-induced stress than under control conditions. However, despite these changes in biomass, the S/R ratio consistently exhibited a lower value under NaCl stress than in control plants. Regarding leaf characteristics, including leaf length and width, no significant differences were observed at 1, 2, or 3 WAT, indicating that salinity stress did not affect these parameters during the experimental period. Leaf number remained relatively stable and did not exhibit significant changes at 1, 2, and 3 WAT between plants subjected to NaCl stress and that of the control plants. Similarly, at 1 and 2 WAT, the leaf area showed no significant changes compared to that of the control. However, at 3 WAT, leaf area was significantly increased by salinity stress, particularly in the 2nd W treatment. The SPAD values revealed interesting dynamics. At 1 and 3 WAT, there were no significant differences between the salinity stress and control. However, at 2 WAT, the SPAD values decreased under salinity stress, suggesting a potential impact on chlorophyll content during this specific period.
Table 2. and Fig. 3 provides a comprehensive examination of arugula growth parameters under varying salinity stress durations measured at 1, 2, and 3 WAT. At 1 WAT, salinity treatment significantly reduced SFW, RFW, and RDW compared to those in the control, indicating a detrimental effect on both shoot and root biomass. However, there were no significant differences in SDW and S/R between the salinity stress treatments and the control. At 2 WAT, SFW and SDW were significantly decreased under the 1st W treatment compared to those in the control group, however, no significant differences were observed in RFW, RDW, and S/R between the salinity stress treatments and the control. By 3 WAT, no significant differences were found in SFW, SDW, RFW, RDW, or S/R between the salinity stress treatments and those in the control. Leaf length showed no significant differences at 1, 2, and 3 WAT between the stress treatments and that in the control. Leaf width under the 1st W treatment significantly decreased compared with that of the control at 1 WAT but showed no significant differences at 2 and 3 WAT. Leaf number exhibited no significant differences under salinity stress compared with that of the control group. Although the leaf area significantly decreased under the 1st W treatment at 1 and 2 WAT, no significant differences were observed between the salinity stress treatments and the control at 3 WAT. A significant increase in SPAD was detected at 1 WAT under NaCl stress conditions compared with that in the control group, however, no significant differences were detected between the salinity stress treatments and the control at 2 and 3 WAT. Arugula responded differently to salinity stress across the three time points with significant effects on various growth parameters.
Table 3 and Fig. 3 presents an insightful analysis of red frill growth parameters under diverse salinity stress treatment durations measured at 1, 2, and 3 WAT. These observations offer valuable insight into red frill response to salinity stress over time. At 1 and 3 WAT, no significant differences were observed in any of the plant growth parameters between the control and the salinity stress treatments. At 2 WAT, no significant differences were found in almost all plant growth parameters, except for leaf number (which was significantly reduced after the 2 W treatment).
Individual GLS and phenol concentrations, total GLS and phenol concentrations, DPPH scavenging activity, POD activity, and SOD activity
Table 4 illustrates the dynamics of GLS concentrations, including progoitrin (PG), sinigrin (SIN), 4-hydroxyglucobrassicin (4OH), glucobrassicanapin (GB), 4-methoxyglucobrassicin (4M), and gluconasturtiin (GNI), within three distinct plant species: pak choi, arugula, and red frill. The study investigates these concentrations under various treatment conditions over a span of 2 to 3 WAT. In pak choi, GLS concentrations exhibited significant variations across treatments and time points. Notably, at 2 WAT, a significant increase in 4OH concentration compared to 3 WAT suggests a prompt response to the treatment administered. Furthermore, at 3 WAT, both 4M and 4OH concentrations at 3rd w treatment displayed significant increments, indicating a cumulative effect over time. Arugula showcased fluctuations in GLS concentrations amidst different treatments and time points. Particularly at 2 WAT under the 1st W treatment, SIN concentrations exhibited a significant rise compared to the control, indicating an early treatment response. However, at 3 WAT, the highest values of SIN and GIN were recorded under the 3rd W, implying a prolonged treatment impact. Red frill demonstrated notably high GLS concentrations, especially at 2 WAT, where a substantial increase in SIN concentration compared to the control was observed. Nonetheless, these concentrations remained relatively stable over time, with no significant changes observed at 3 WAT compared to the control.
Table 5 presents the concentrations of diverse phenolic compounds, including galic acid (GA), chlorogenic acid (CGA), 4-hydroxybenzoic acid (4HB), caffeic acid (CA), (-)-epicatechin ((-)-Ep), trans-ferulic acid (TFA), benzoic acid (BA), rutin (Ru), and trans-cinnamic acid (TCA), within three plant species: Pak choi, arugula, and red frill, across different treatment conditions and time points over a span of 2 to 3 WAT. Phenolic compound concentrations in pak choi exhibited significant variations across treatments and time points. Notably, at 2 WAT, there were notable increases in CGA concentrations under the 2w treatment compared to the control. Additionally, at 3 WAT, concentrations of BA and Ru peaked under the 1st W and 2nd W treatments, respectively, suggesting a cumulative effect over time. Arugula demonstrated distinctive patterns in phenolic compound concentrations under various treatments and time points. At 2 WAT, significant elevations in CA concentrations were observed under the 2nd W treatment for both 2 WAT and 3 WAT compared to the control, signifying a rapid treatment response. Similarly, phenolic compound concentrations in red frill exhibited notable variations across treatments and time points. Particularly at 3rd W under 3 WAT, a significant increase in CGA concentration was observed compared to the control.
Fig. 4 shows that the maximum total GLS concentration in pak choi and arugula occurred in the 3rd W salinity treatment at 3 WAT. Under salinity stress at 2 WAT, pak choi in 2nd W exhibited a significant decrease in GLS concentration compared to that of the control (Fig. 4A). The peak total phenol concentration in pak choi at 3 WAT was observed during the 1st W salinity treatment. Arugula displayed the highest total phenol concentration under the 2nd W salinity treatment at 2 and 3 WAT (Fig. 4B). No significant differences in the total phenol and GLS concentrations were observed in red frill between the control group and salinity stress treatments (Fig. 4C and 4F). The DPPH radical-scavenging activity of pak choi was not significantly different between the control and salinity stress treatments at 2 WAT. However, the 1st W salinity treatment at 3 WAT resulted in the highest DPPH scavenging activity in pak choi. There were no significant differences in arugula and red frill DPPH scavenging activity between the control and salinity stress treatments at 2 and 3 WAT (Fig. 5B and 5C). Pak choi exhibited the highest SOD activity under the 1st and 3rd W salinity treatments at 2 and 3 WAT, respectively (Fig. 5D). Arugula showed no significant differences in SOD activity between the control and salinity stress treatments at 2 WAT. At 3 WAT, SOD values were significantly higher in the 2nd and 3rd W salinity treatments than that in the control (Fig. 5E). Red frill showed SOD enzyme levels were reduced under the 1st and 2nd W salinity treatments compared to that in the control (Fig. 5F). POD activity in pak choi and arugula peaked under the 3rd W salinity treatment at 2 and 3 WAT. Nevertheless, no significant differences were observed in POD enzyme activity in red frill between the salinity stress treatments and the control (Fig. 6).
Discussion
The results presented in Tables 1, 2, and 3 and Fig. 3 provide a detailed understanding of pak choi, arugula, and red frill responses to salinity stress at different time points after transplantation. Regarding pak choi, in the initial weeks (1 and 2 WAT) no significant variations in shoot and root biomass were observed under salinity stress treatments compared with the control. However, at 2 WAT, a significant reduction in the S/R ratio was observed in the 1st W treatment, which may indicate a shift in resource allocation toward root development. The subsequent increase in SFW at 3 WAT under the 2nd W stress conditions suggested an adaptive response, possibly driven by enhanced water uptake or altered metabolic processes (Muchate et al., 2016). The consistent decrease in the S/R ratio at 3 WAT implied root growth prioritization under salinity stress (Zou et al., 2022). Leaf characteristics, including length, width, number, and area remained relatively stable during the early weeks of stress. However, at 3 WAT, a significant increase in leaf area under the 2nd W salinity stress conditions suggests a compensatory mechanism (Zahra et al., 2022). SPAD values displayed a dynamic response. Although no significant changes were observed at 1 and 3 WAT, a decrease at 2 WAT implied a potential impact on photosynthetic efficiency during this critical period. This aligns with previous studies that highlighted the vulnerability of chlorophyll synthesis to environmental stressors (Hameed et al., 2021; Song et al., 2021). Magnesium is a critical element for chlorophyll synthesis, as it is a central component of the chlorophyll molecule. When plants are exposed to high levels of sodium due to salinity stress, magnesium uptake and utilization can be impaired. This magnesium deficiency within the plant inhibits the synthesis of chlorophyll molecules (Ahmed et al., 2023). These results underscore the intricate interplay among biomass allocation, leaf morphology, and chlorophyll dynamics in the adaptation of pak choi to salinity stress, with pronounced effects emerging at different stages.
Arugula exhibits distinct responses to salinity stress at different time points. At 1 WAT, significant reductions in SFW, RFW, and RDW had detrimental effects on the overall biomass. Salinity stress negatively impacts multiple physiological processes essential for plant growth and development, including water uptake, ion balance, nutrient uptake, photosynthesis, and cellular integrity. These effects collectively contribute to a reduction in plant biomass under saline conditions (Zhao et al., 2021; Balasubramaniam et al., 2023). However, the lack of significant changes in SDW and S/R ratios suggests potential resilience in resource allocation. At 2 WAT, decreases in both SFW and SDW during the 1st W treatment indicated a sustained effect on shoot biomass. Leaf characteristics, including leaf width, exhibited sensitivity to stress at 1 WAT but recovered in subsequent weeks. The increase in SPAD values at 1 WAT suggests an initial response to maintain chlorophyll levels, possibly as a mechanism to mitigate the effect on photosynthesis. By 3 WAT, arugula appeared to acclimate to salinity stress, with no significant differences in most growth parameters compared with those of the control. This resilience is indicative of adaptive mechanisms that allow arugula to overcome the initial salinity stress and resume normal growth (Maryum et al., 2022).
Red frill displayed an initial tolerance or resilience to salinity stress at 1 and 3 WAT, as evidenced by the absence of significant differences in most growth parameters compared with those of the control. However, at 2 WAT, a reduction in leaf number under the 2nd W treatment suggests a specific vulnerability during this period. The findings for red frill highlighted the species-specific response to salinity stress and the importance of considering temporal dynamics. The ability of red frill mustard to maintain its growth parameters during the early and late stages of stress indicates a robust adaptive capacity.
The observed temporal dynamics of the pak choi, arugula, and red frill responses underscore the need for a nuanced understanding of plant stress physiology. Variations in biomass allocation, leaf characteristics, and chlorophyll content at different time points emphasize the importance of considering stress duration when assessing plant responses. This temporal variability aligns with the existing literature, emphasizing the complexity of plant salinity stress responses over time (Isayenkov and Maathuis, 2019; Ibrahimova et al., 2021).
The results of this study revealed the intricate responses in pak choi, arugula and red frill biochemical parameters under different salinity treatments. The observed variations in GLS and phenol concentrations, DPPH scavenging activity, and SOD and POD enzyme activity provided valuable insight into the adaptive strategies employed by these plant species to cope with salinity stress. The maximum total GLS concentration observed in arugula under the 2nd W salinity treatment at 2 and 3 WAT suggests a potential role in salinity stress responses (Martínez-Ballesta et al., 2013). GLS is involved in plant defense mechanisms against various environmental stresses (Abdel-Massih et al., 2023). The significant increase in their concentrations may indicate a concerted effort by the plants to bolster their defense systems during the 2nd W treatment. The dynamic response of the total phenol concentration in pak choi highlights its sensitivity to salinity stress at 2 WAT, as evidenced by a significant decrease compared to that in the control. However, the subsequent peak in total phenol concentration at 3 WAT under the 1st W salinity treatment suggests a compensatory mechanism, possibly triggered by an adaptive response to mitigate stress-induced damage (Rai et al., 2023). Arugula exhibited the highest total phenol concentration under the 2nd W salinity treatments at 2 and 3 WAT, indicating species-specific temporal phenolic compound modulation in response to salinity stress (Linic et al., 2019). The DPPH scavenging activity of pak choi was not significantly different between the control and salinity stress treatments at 2 WAT, suggesting that antioxidant defense mechanisms may not be fully activated during the early stages of stress. However, the notably increased DPPH scavenging activity under the 1st W salinity treatment at 3 WAT implied an intensified antioxidant response, possibly as a countermeasure against prolonged stress conditions (Singh et al., 2023). SOD activity in pak choi displayed a complex pattern, with the highest activity observed in the 1st and 3rd W salinity treatments at 2 and 3 WAT, respectively. This dual response suggests a nuanced relationship between salinity regimes and antioxidant defense, with both excessive and limited salinity inducing higher SOD activity (Li et al., 2023). In arugula, the lack of a significant difference in SOD between the control and salinity stress treatments at 2 WAT indicates a potential tolerance to salinity at this early stage. However, the significantly higher SOD values under the 2nd and 3rd W salinity treatments at 3 WAT suggest an enhanced antioxidant defense mechanism against prolonged salinity stress (Hasanuzzaman et al., 2021). The observed reduction in SOD activity at 2 WAT under salinity stress compared to that in the control group in red frill may reflect the initial suppression of the antioxidant system. However, the subsequent decrease in SOD enzyme levels under the 1st and 2nd W salinity treatments at 3 WAT suggests a potential negative effect of prolonged water stress on antioxidant defenses (Hasanuzzaman et al., 2021). This reduction in SOD levels under specific treatments may indicate a complex interplay among salinity, watering regimes, and antioxidant responses. POD activity in pak choi and arugula peaked under the 2nd and 3rd W salinity treatments at 2 and 3 WAT, respectively, suggesting a robust induction of POD-mediated defense mechanisms during these periods (Shahzad et al., 2022). However, the absence of significant differences in POD enzyme activity in red frill between the salinity stress treatments and the control group implies a unique adaptive strategy or lesser reliance on POD activity in this species. These findings contribute to our understanding of plant responses to salinity stress and may inform strategies for enhancing crop resilience in saline environments.
Materials and methods
Plant growth and salt treatments
Pak choi (Brassica campestris L.), arugula (Eruca sativa Mill.), and red frill (Brassica juncea L.) seeds were purchased from Asia Seed Co., Ltd. (Seoul, Korea). Seeds were sown in rockwool plugs (AO Plug, Grodan, Poland) and each plug cell was separated and placed in a 105-hole seedling tray. The seedling environment was maintained at 23 ± 2°C, 200 ± 20 μmol·m−2·s−1 light intensity, 70–75% humidity, and a 16/8 h (light/dark) photoperiod. The initial dark treatment was maintained for 48 h, and the seedlings were irrigated daily using a low surface irrigation method. After the appearance of three true leaves, the plants were irrigated with a nutrient solution (Korea Horticulture Experiment (KHE) (Ahn et al., 2022). The mineral salts used for the A KHE nutrient solution were FeEDTA (electrical conductivity (EC) 2.0 dS∙m-1 and pH 6.5): 40.0 mg.L−1; Ca(NO₃)2∙4H₂O: 1026.0 mg.L−1; NH4NO3: 24.0 mg.L−1 and KNO₃: 250.0 mg.L−1 and those employed for the B Hoagland nutrient solution were H₃BO₃: 4.5 mg.L−1; MnSO₄∙4H₂O: 3.0 mg.L−1; ZnSO₄∙7H₂O: 0.57 mg.L−1; CuSO₄∙5H₂O: 0.50 mg.L−1; NaMoO₄∙2H₂O: 0.04 mg.L−1; KNO₃: 255.6 mg.L−1; MgSO₄∙7H₂O: 493.0 mg.L−1; NH₄H₂PO₄: 80.1 mg.L−1; and KH2PO4: 136.1 mg.L−1. Three weeks after sowing, the seedlings were transplanted into the ebb and flow system in a rooftop greenhouse with natural light at the Korea Institute of Machinery for three weeks (Fig. 2). The EC and pH of the KHE nutrient solution during cultivation was set at 2.0 ± 0.2 dS.m-1 and 6.0 ± 0.2, respectively, and it was replaced with fresh nutrient solution once a week. In addition, the trays with plants were moved periodically to avoid location effects.
In this experimental setup, a sodium chloride (NaCl) solution with a measured EC of 12.6 dS∙m-1 was introduced to the rhizosphere for 24-h at specific time intervals: from 2:00 pm on day 6 to 2:00 pm on day 7 (1st week (W), 2:00 pm on day 13 to 2:00 pm on day 14 (2nd W), and 2:00 pm on day 20 to 2:00 pm on day 21 (3rd W), serving as salinity stress treatments (Fig. 1). Following each 24-h exposure, the nutrient solution was promptly replaced with the original nutrient solution delivered through the ebb and flow system. Plant growth parameters were measured at specific time points: from 2:00 pm on day 7 (1 week after transplantation (WAT)), from 2:00 pm on day 14 (2 WAT), and from 2:00 pm on day 21 (3 WAT). Subsequently, samples for GLS, phenolic compound, and antioxidant enzyme analysis.
Growth parameter measurements
To investigate pak choi, arugula, and red frill growth, four samples (n = 4) from each replication were collected at 1, 2, and 3 WAT. Leaf number was measured by direct counting, and the length and width of the largest leaf were measured using a caliper (SD500-300PRO, Shin Con Co., Ltd., Korea). Leaf area was determined using a leaf area meter (LI-3100; LI-COR Co., Lincoln, NE, USA), and the relative chlorophyll (SPAD) value was measured using a portable chlorophyll meter SPAD-502 (Minolta Camera Co., Ltd., Japan). Shoot fresh (SFW) and shoot dry weights (SDW) were measured with an electronic balance (MW2N, CAS Co. Ltd., Korea), and for the DW investigation, the samples were dried in a 70°C desiccator (HB-501M, Hanbaek Scientific Technology Co., Ltd., Bucheon, Korea) for one week and then weighed with an electronic balance. The shoot-to-root (S/R) ratio was determined by dividing the SDW by the root dry weight (RDW).
Glucosinolate content analysis
The glucosinolate (GLS) concentrations of pak choi, arugula, and red frill was analyzed using HPLC (1260 Infinity Series, Agilent Technologies Inc., California, USA) based on the method of Kim et al. 2017 and Lam et al. 2019 (Kim et al., 2017; Lam et al., 2019). The shoot samples from three Brassicaceae plants were freeze-dried at -70°C for three days using a TFD5503 freeze dryer (ilShinBioBase, Dongducheon, Korea), then ground into powder. Each 100 mg powder sample was mixed with 1.5 mL of 70% methanol and heated at 70°C for 5 minutes to extract crude glucosinolates. The supernatant was collected after centrifugation at 12,000 rpm for 10 minutes (Hanil Scientific R17 Plus microcentrifuge, Gimpo, Korea). The supernatant underwent desulfurization using DEAE Sephadex A-25 ion exchanger (Sigma-Aldrich Korea, Seoul, South Korea) and was filtered through a 0.45 μm filter. Glucosinolates were quantified using HPLC on an Agilent 1200 Infinity system (Santa Clara, CA, USA) with an Inertsil ODS-3 (C18) column (150 × 3.0 mm, 3 μm particle size) at 40°C. A gradient elution with water and acetonitrile over 27 minutes at 227 nm detected individual glucosinolates. Quantification followed ISO 9167-1 (1992) guidelines using desulfo-sinigrin as a reference standard (Chun et al., 2018).
2,2-diphenyl-1-picrylhydrazyl (DPPH) radical scavenging assay
Three shoot samples from three Brassicaceae plants of each replication were promptly frozen in liquid nitrogen post-harvest and subsequently stored at -70°C. Next, the samples were transferred to a dry freezer (TFD5503, ILShin Biobase Co., Ltd., Korea) maintained at -70°C. Afterward, each sample was finely ground using a porcelain mortar and pestle, and the resulting powder was passed through mesh sieves. The DPPH radical scavenging ability was assessed using a modified version of Lam et al. 2023 (Lam et al., 2023). The DPPH solution was prepared by mixing DPPH (D9132, Sigma-Aldrich, USA) (200 mg) and MeOH (50 mL). 90% MeOH (170 μL), DPPH solution (10 μL), and the sample (20 μL) were mixed and reacted in the dark for 30 min, and the absorbance was measured at 517 nm. The control was no sample, and the DPPH radical scavenging rate percentage was calculated using the following formula (n = 3):
$$DPPH\ radical\ scavenging\ rate\ (\%) = \ \frac{A517\ control - A517\ sample}{A517\ control} \times 100\%$$
Superoxide dismutase (SOD) activity
The sample extraction was conducted with the same extraction of the DPPH radical scavenging assay. SOD activity was assessed using a modified version of the method described by Kiani et al. 2021 (Kiani et al., 2021; Lam et al., 2023). The reaction mixture was prepared by thoroughly mixing 50 mM pH 7.0 sodium phosphate (93.5 μL), 0.1 M methionine (52 μL), 2.5 mM NBT (24.5 μL), 10 mM EDTA (2 μL), 0.5 mM riboflavin (8 μL). The control did not contain enzyme extract and was simultaneously exposed to LED light with a PPFD of 50 μmol·m−2·s−1 for 15 min, after which the light was blocked. The absorbance was then measured at 560 nm, and SOD activity was expressed as units mg−1 DW by substituting the following formula based on the amount of enzyme that caused a 50% reduction in NBT (n = 3). The blank was stored in the dark with no enzyme extract in the reaction mixture, and absorbance was measured to confirm thermal equilibrium.
$$SOD\ inhibition\ \ (\%) = \ \frac{A517\ control - A517\ enzyme}{A517\ control} \times 100\%$$
$$SOD\ activity\ \left( unit\ {mL}^{- 1} \right) = \ \frac{SOD\ inhibition \times total\ volume}{50 \times enzyme\ volume}$$
$$SOD\ activity\ (unit) = \ \frac{unit{\ mL}^{- 1}}{enzyme\ (mg\ {mL}^{- 1})}$$
Peroxidase (POD) activity
The sample extraction was conducted with the same extraction of the DPPH radical scavenging assay. POD activity was assessed by modifying the method described by Kiani et al. 2021 (Kiani et al., 2021; Lam et al., 2023). The reaction mixture was constituted by combining 66.6 μL of 40 mM sodium phosphate buffer (pH 6.1), 80 μL of 20 mM guaiacol, and 33.3 μL of 3% hydrogen peroxide (H2O2). Subsequently, 20 μL of enzyme extract was introduced into this mixture. Absorbance readings were taken at 470 nm at 10-s intervals. POD activity was quantified in µmol min−1·mg−1 DW, based on the formula provided, and the procedure was replicated four times (n = 3).
$$POD\ activity\ \left( µmol\ \min^{- 1}{mL}^{- 1} \right) = \frac{\left( \frac{A470}{\min} \right)\ \times \ total\ volume\ \times \ 1000}{26.6\ \times \ enzyme\ volume}$$
$$POD\ activity\ \left( µmol\ \min^{- 1}{mg}^{- 1}DW \right) = \ \frac{unit{\ mL}^{- 1}}{enzyme\ (mg\ {mL}^{- 1})}$$
Absorbance readings were taken at 470 nm for 1 min, using an extinction coefficient of 26.6 mM−1·cm−1.
Total phenolic compounds
To analyze the phenolic compounds of pak choi, arugula, and red frill using high-performance liquid chromatography (hplc, 1260 infinity series, agilent technologies inc., ca, usa) (Meyer et al., 2021; Yeo et al., 2021), The plant shoots were freeze-dried, powdered, and a 100 mg sample was mixed with 2 mL of 80% MeOH. After 1 hour of sonication and periodic vortexing, the mixture was centrifuged at 12,000 g for 10 minutes. The supernatant was filtered (0.45 µm) and prepared for HPLC analysis using a Symmetry C18 column (250 × 4.6 mm, 5 µm) at 30°C, 1.0 mL/min flow rate, and 280 nm detection. 0.15% (v/v) acetic acid water (A) and MeOH (B) were used as the solvent systems. The gradient program (total of 98 minutes) was used as follows: 5% solvent B (0 min); 5% solvent B (0 - 1 min); 15% solvent B (1 - 9 min); 20% solvent B (9 - 24 min); 30% solvent B (24 - 54 min); 45% solvent B (54 - 66 min); 56% solvent B (66 - 76 min); 60% solvent B (76 - 80 min); 80% solvent B (80 - 91 min); 5% solvent B (91 - 98 min). The individual phenol components (gallic acid, chlorogenic acid, 4-hydroxybenzoic acid, caffeic acid, (-)-epicatechin, 4-hydroxy3-benzoic acid, trans-ferulic acid, benzoic acid, rutin, and trans-cinnamic acid).
Statistical analysis
The experiment was performed using a completely randomized design and repeated twice. Plant growth parameters were measured using four plants (n = 4) per replication, while GLS, phenolic compounds, and antioxidant contents were analyzed using three plants (n = 3) per replication. One-way ANOVA was performed using SPSS 20.0 (SPSS, Inc., Chicago, IL, USA). Tukey's multiple comparison test was used to determine significant differences among mean values at a significance level of p ≤ 0.05. Graphs were created using SigmaPlot 10.0 (Systat Software, Inc., San Jose, CA, USA).
Conclusion
A comprehensive assessment of pak choi, arugula, and red frill under varying salinity stress conditions revealed their distinctive temporal dynamic responses. Plant growth parameters highlighted the nuanced effects of salinity stress on biomass, leaf characteristics, and chlorophyll content over different WAT. Additionally, biochemical analyses revealed variations in total GLS and phenol concentrations, DPPH scavenging activity, and SOD activity. Regarding pak choi, the 2nd W salinity treatment at 3 WAT showed favorable results in terms of biomass and biochemical responses. Arugula responses varied across the time points, suggesting a need for tailored strategies. The 2nd W treatment at 3 WAT exhibited fewer detrimental effects on biomass. Red frill initial tolerance suggests that the 1st and 3rd W treatments may be optimal for maintaining growth and biochemical activity. Further research is warranted to explore the underlying molecular mechanisms and refine cultivation strategies for sustainable green leaf production under salinity-stress conditions. In conclusion, this study highlights the intricate interplay between salinity stress and plant responses and emphasizes the importance of temporal considerations for effective cultivation management. These findings provide valuable insights for optimizing treatments and advancing our understanding of the resilience of leafy greens to environmental salinity stress.
Conflicts of Interest: There are no conflicts of interest to declare.
Acknowledgements: This work was supported by Korea Institute of Energy Technology Evaluation and Planning (KETEP) grant funded by the Korea government (MOTIE) (20212020800050).
Author contribution statement: V.P.L. data collection and analysis, writing-original manuscript, writing-review and editing. J.B. performed the experiments, data collection and analysis. S.H.H. performed the experiments. J.S.P. Project administration, supervision, conceptualization, experimental design, writing-original manuscript, and writing-review and editing.
References
Abdel-Massih RM, Debs E, Othman L, Attieh J, Cabrerizo FM (2023) Glucosinolates, a natural chemical arsenal: More to tell than the myrosinase story. Front Microbiol. 14: 1130208. 10.3389/fmicb.2023.1130208.
Ahmed N, Zhang BG, Bozdar B, Chachar S, Rai M, Li J, Li YQ, Hayat F, Chachar Z, Tu PF (2023) The power of magnesium: unlocking the potential for increased yield, quality, and stress tolerance of horticultural crops. Front Plant Sci. 14: 1285512. 10.3389/fpls.2023.1285512.
Ahn YH, Noh SW, Kim SJ, Park JS (2022) Selection of appropriate nutrient solution for simultaneous hydroponics of three leafy vegetables (Brassicaceae ). Korean j. agric. sci. 49: 643-654. 10.7744/kjoas.20220058.
Balasubramaniam T, Shen GX, Esmaeili N, Zhang H (2023) Plants' response mechanisms to salinity stress. Plants. 12: 2253. 10.3390/plants12122253.
Cartea ME, Francisco M, Soengas P, Velasco P (2011) Phenolic compounds in vegetables. Molecules. 16: 251-280. 10.3390/molecules16010251.
Chhajed S, Mostafa I, He Y, Abou-Hashem M, El-Domiaty M, Chen SX (2020) Glucosinolate biosynthesis and the glucosinolate-myrosinase system in plant defense. Agronomy. 10: 1786. 10.3390/agronomy10111786.
Chun JH, Kim NH, Seo MS, Jin M, Park SU, Arasu MV, Kim SJ, Al-Dhabi NA (2018) Molecular characterization of glucosinolates and carotenoid biosynthetic genes in Chinese cabbage (Brassica rapa L. ssp. pekinensis). Saudi J Biol Sci. 25: 71-82. 10.1016/j.sjbs.2016.04.004.
Connolly EL, Sim M, Travica N, Marx W, Beasy G, Lynch GS, Bondonno CP, Lewis JR, Hodgson JM, Blekkenhorst LC (2021) Glucosinolates from cruciferous vegetables and their potential role in chronic disease: investigating the preclinical and clinical evidence. Front Pharmacol. 12: 767975. 10.3389/fphar.2021.767975.
Falcinelli B, Sileoni V, Marconi O, Perretti G, Quinet M, Lutts S, Benincasa P (2017) Germination under moderate salinity increases phenolic content and antioxidant activity in rapeseed (Brassica napus var oleifera Del.) sprouts. Molecules. 22: 1377. 10.3390/molecules22081377.
Guo LP, Yang RQ, Wang ZY, Guo QH, Gu ZX (2014) Effect of NaCl stress on health-promoting compounds and antioxidant activity in the sprouts of three broccoli cultivars. IInt J Food Sci Nutr. 65: 476-481. 10.3109/09637486.2013.860583.
Hameed A, Ahmed MZ, Hussain T, Aziz I, Ahmad N, Gul B, Nielsen BL (2021) Effects of salinity stress on chloroplast structure and function. Cells. 10: 2023. 10.3390/cells10082023.
Hasanuzzaman M, Raihan MRH, Masud AAC, Rahman K, Nowroz F, Rahman M, Nahar K, Fujita M (2021) Regulation of reactive oxygen species and antioxidant defense in plants under salinity. Int J Mol Sci. 22: 9326. 10.3390/ijms22179326.
Ibrahimova U, Kumari P, Yadav S, Rastogi A, Antala M, Suleymanova Z, Zivcak M, Tahjib-Ul-Arif M, Hussain S, Abdelhamid M, Hajihashemi S, Yang XH, Brestic M (2021) Progress in understanding salt stress response in plants using biotechnological tools. J Biotechnol. 329: 180-191. 10.1016/j.jbiotec.2021.02.007.
Isayenkov SV, Maathuis FJM (2019) Plant salinity stress: Many unanswered questions remain. Front Plant Sci. 10: 80. 10.3389/fpls.2019.00080.
Ishida M, Hara M, Fukino N, Kakizaki T, Morimitsu Y (2014) Glucosinolate metabolism, functionality and breeding for the improvement of Brassicaceae vegetables. Breed Sci. 64: 48-59. 10.1270/jsbbs.64.48.
Jasper J, Wagstaff C, Bell L (2020) Growth temperature influences postharvest glucosinolate concentrations and hydrolysis product formation in first and second cuts of rocket salad. Postharvest Biol Technol. 163: 111157. 10.1016/j.postharvbio.2020.111157.
Kiani T, Mehboob F, Hyder MZ, Zainy Z, Xu LS, Huang L, Farrakh S (2021) Control of stripe rust of wheat using indigenous endophytic bacteria at seedling and adult plant stage. Sci Rep. 11: 14473. 10.1038/s41598-021-93939-6.
Kim MJ, Chiu YC, Kim NK, Park HM, Lee CH, Juvik JA, Ku KM (2017) Cultivar-specific changes in primary and secondary metabolites in pak choi (Brassica Rapa, Chinensis group) by methyl jasmonate. Int J Mol Sci. 18: 1004. 10.3390/ijms18051004.
Lam VP, Choi J, Kim S, Park J, Hernandez R (2019) Optimizing plant spacing and harvest time for yield and glucosinolate accumulation in watercress (Nasturtium officinale L.) grown in a hydroponic system. Hortic Sci Technol. 37: 733-743. 10.7235/Hort.20190073.
Lam VP, Loi DN, Kim S, Shin J, Park J (2023) Ozonated water soaking improves the flower growth, antioxidant activity, and bioactive compound accumulation in Agastache rugosa. Chem Biol Technol Ag. 10. 10.1186/s40538-023-00496-3.
Li ZH, Xing SY, Li P, He SW, Cao ZH, Wang X, Cao XQ, Liu B, You H (2023) Systematic toxicological analysis of the effect of salinity on the physiological stress induced by triphenyltin in Nile tilapia. Aquat Toxicol. 257: 106441. 10.1016/j.aquatox.2023.106441.
Linic I, Samec D, Grúz J, Bok VV, Strnad M, Salopek-Sondi B (2019) Involvement of phenolic acids in short-term adaptation to salinity stress is species-specific among Brassicaceae. Plants. 8: 155. 10.3390/plants8060155.
Martínez-Ballesta MD, Moreno DA, Carvajal M (2013) The physiological importance of glucosinolates on plant response to abiotic stress in Brassica. Int J Mol Sci. 14: 11607-11625. 10.3390/ijms140611607.
Maryum Z, Luqman T, Nadeem S, Khan SMUD, Wang BH, Ditta A, Khan MKR (2022) An overview of salinity stress, mechanism of salinity tolerance and strategies for its management in cotton. Front Plant Sci. 13: 907937. 10.3389/fpls.2022.907937.
Melim C, Lauro MR, Pires IM, Oliveira PJ, Cabral C (2022) The role of glucosinolates from cruciferous vegetables (Brassicaceae) in gastrointestinal cancers: from prevention to therapeutics. Pharmaceutics. 14: 190. 10.3390/pharmaceutics14010190.
Meyer P, Förster N, Huyskens‐Keil S, Ulrichs C, Geilfus CM (2021) Phenolic compound abundance in Pak choi leaves is controlled by salinity and dependent on pH of the leaf apoplast. Plant Environ Interact. 2: 36-44. 10.1002/pei3.10039.
Miao HY, Zeng W, Wang JS, Zhang F, Sun B, Wang QM (2021) Improvement of glucosinolates by metabolic engineering in crops. Abiotech. 2: 314-329. 10.1007/s42994-021-00057-y.
Muchate NS, Nikalje GC, Rajurkar NS, Suprasanna P, Nikam TD (2016) Plant salt stress: Adaptive responses, tolerance mechanism and bioengineering for salt tolerance. Botanical Review. 82: 371-406. 10.1007/s12229-016-9173-y.
Pavlovic I, Mlinaric S, Tarkowská D, Oklestkova J, Novák O, Lepedus H, Bok VV, Brkanac SR, Strnad M, Salopek-Sondi B (2019) Early crops responses to salinity stress: A comparative analysis between chinese cabbage, white cabbage, and kale. Frontiers in Plant Science. 10: 450. 10.3389/fpls.2019.00450.
Podsedek A (2007) Natural antioxidants and antioxidant capacity of Brassica vegetables: A review. Lwt-Food Science and Technology. 40: 1-11. 10.1016/j.lwt.2005.07.023.
Rai GK, Mishra S, Chouhan R, Mushtaq M, Chowdhary AA, Rai PK, Kumar RR, Kumar P, Perez-Alfocea F, Colla G, Cardarelli M, Srivastava V, Gandhi SG (2023) Plant salinity stress, sensing, and its mitigation through WRKY. Front Plant Sci. 14: 1238507. 10.3389/fpls.2023.1238507.
Rouphael Y, Petropoulos SA, Cardarelli M, Colla G (2018a) Salinity as eustressor for enhancing quality of vegetables. Sci Hortic. 234: 361-369. 10.1016/j.scienta.2018.02.048.
Rouphael Y, Petropoulos SA, Cardarelli M, Colla G (2018b) Salinity as eustressor for enhancing quality of vegetables. Scientia Horticulturae. 234: 361-369. 10.1016/j.scienta.2018.02.048.
Samec D, Linic I, Salopek-Sondi B (2021) Salinity stress as an elicitor for phytochemicals and minerals accumulation in selected leafy vegetables of Brassicaceae. Agronomy. 11: 361. 10.3390/agronomy11020361.
Samec D, Pavlovic I, Redovnikovic IR, Salopek-Sondi B (2018) Comparative analysis of phytochemicals and activity of endogenous enzymes associated with their stability, bioavailability and food quality in five Brassicaceae sprouts. Food Chemistry. 269: 96-102. 10.1016/j.foodchem.2018.06.133.
Sarker U, Oba S (2018) Augmentation of leaf color parameters, pigments, vitamins, phenolic acids, flavonoids and antioxidant activity in selected Amaranthus tricolor under salinity stress. Sci Rep. 8: 12349. 10.1038/s41598-018-30897-6.
Sarker U, Oba S (2019) Salinity stress enhances color parameters, bioactive leaf pigments, vitamins, polyphenols, flavonoids and antioxidant activity in selected leafy vegetables. J Sci Food Agr. 99: 2275-2284. 10.1002/jsfa.9423.
Shahzad B, Rehman A, Tanveer M, Wang L, Park SK, Ali A (2022) Salt stress in: Effects, tolerance mechanisms, and management. J Plant Growth Regul. 41: 781-795. 10.1007/s00344-021-10338-x.
Singh A, Rajput VD, Sharma R, Ghazaryan K, Minkina T (2023) Salinity stress and nanoparticles: Insights into antioxidative enzymatic resistance, signaling, and defense mechanisms. Environ Res. 235: 116585. 10.1016/j.envres.2023.116585.
Soengas P, Velasco P, Fernandez JC, Cartea ME (2021) New vegetable foods: A promising source of bioactive compounds. Foods. 10: 2911. 10.3390/foods10122911.
Song Y, Feng L, Alyafei MAM, Jaleel A, Ren MZ (2021) Function of chloroplasts in plant stress responses. Int J Mol Sci. 22: 1326–1334. 10.3390/ijms222413464.
Velasco P, Francisco M, Moreno DA, Ferreres F, García-Viguera C, Cartea ME (2011) Phytochemical fingerprinting of vegetable and by simultaneous identification of glucosinolates and phenolics. Phytochemical Analysis. 22: 144-152. 10.1002/pca.1259.
Yeo HJ, Baek SA, Sathasivam R, Kim JK, Park SU (2021) Metabolomic analysis reveals the interaction of primary and secondary metabolism in white, pale green, and green pak choi (Brassica rapa subsp. chinensis). Appl Biol Chem. 64: 3. 10.1186/s13765-020-00574-2.
Yuan GF, Wang XP, Guo RF, Wang QM (2010) Effect of salt stress on phenolic compounds, glucosinolates, myrosinase and antioxidant activity in radish sprouts. Food Chemistry. 121: 1014-1019. 10.1016/j.foodchem.2010.01.040.
Zahra N, Al Hinai MS, Hafeez MB, Rehman A, Wahid A, Siddique KHM, Farooq M (2022) Regulation of photosynthesis under salt stress and associated tolerance mechanisms. Plant Physiol Bioch. 178: 55-69. 10.1016/j.plaphy.2022.03.003.
Zhao SS, Zhang QK, Liu MY, Zhou HP, Ma CL, Wang PP (2021) Regulation of plant responses to salt stress. Int J Mol Sci. 22: 4609. 10.3390/ijms22094609.
Zou YT, Zhang YX, Testerink C (2022) Root dynamic growth strategies in response to salinity. Plant Cell Environ. 45: 695-704. 10.1111/pce.14205.
Table 1. Growth parameters of pak choi under different salinity stress treatment timing at (1st, 2nd, and 3rd W; 1w, 2w, and 3 w) measured at 1, 2, and 3 weeks after transplanting.
| Measurement timing | Treatments | SFWx (g) | SDW (g) | RFW (g) | RDW (g) | Leaf length (cm) | Leaf width (cm) | Leaf number | SPAD values | Leaf area (cm2) | S/R |
|---|---|---|---|---|---|---|---|---|---|---|---|
| 1 WATz | Control | 5.7 | 0.41 | 0.54 | 0.04 | 10.05 | 4.85 | 9.25 | 37.43 | 97.73 | 10.25 |
| 1w | 5.32 | 0.44 | 0.61 | 0.06 | 9.63 | 5.03 | 10.75 | 38.95 | 104.2 | 7.33 | |
| Significancey | NS | NS | NS | NS | NS | NS | NS | NS | NS | NS | |
| 2 WAT | Control | 33.03 | 2.28 | 2.84 | 0.21 | 16.55 | 9.05 | 11.25 | 40.05 a | 533.77 | 10.86 a |
| 1w | 34.55 | 2.30 | 4.28 | 0.28 | 16.1 | 8.65 | 11.75 | 38.45 b | 540.36 | 8.21 b | |
| 2w | 33.20 | 2.35 | 3.23 | 0.26 | 15.98 | 8.85 | 11.25 | 39.45 b | 537.96 | 9.04 a | |
| Significancey | NS | NS | NS | NS | NS | NS | NS | * | NS | * | |
| 3 WAT | Control | 81.80 b | 5.18 c | 4.66 c | 0.42 c | 16.17 | 9.15 | 14.75 | 37.9 | 916.85 b | 12.33 a |
| 1w | 82.22 b | 6.46 ab | 7.12 ab | 0.68 b | 18.2 | 10.05 | 15. | 38.08 | 1055.36 ab | 9.50 b | |
| 2w | 98.38 a | 7.27 a | 8.05 a | 0.75 a | 18.28 | 9.98 | 15.5 | 37.93 | 1106.70 a | 9.69 b | |
| 3w | 80.64 b | 6.01 bc | 6.06 b | 0.59 b | 18.75 | 9.65 | 13.25 | 37.3 | 905.40 b | 10.18 b | |
| Significancey | * | * | * | * | NS | NS | NS | NS | * | * |
xSignificant at *p ≤ 0.05, NS: Not significant. yMeans of four measurements (n = 4) with different letters are significantly different (p ≤ 0.05) by Tukey’s multiple range test). zWAT: Week after transplanting. SFW: Shoot fresh weight; SDW: Shoot dry weight; RFW: Root fresh weight; RDW: Root dry weight.
Table 2. Growth parameters of arugula under different salinity stress treatment timing at (1st, 2nd, and 3rd W; 1w, 2w, and 3 w) measured at 1, 2, and 3 weeks after transplanting.
| Measurement timing | Treatments | SFW (g) | SDW (g) | RFW (g) | RDW (g) | Leaf length (cm) | Leaf width (cm) | Leaf number | SPAD | Leaf area (cm2) | S/R |
|---|---|---|---|---|---|---|---|---|---|---|---|
| 1WATz | Control | 2.54 ay | 0.22 | 0.51 a | 0.04 a | 9.35 | 3.4 a | 8 | 43.1 b | 44.22 a | 5.5 |
| 1w | 1.75 b | 0.21 | 0.25 b | 0.02 b | 8.55 | 2.5 b | 8.75 | 48.75 a | 28.59 b | 10.5 | |
| Significancex | * | NS | * | * | NS | * | NS | * | * | NS | |
| 2WAT | Control | 10.54 a | 1.01 a | 2.68 | 0.16 | 19.17 | 5.33 | 8.25 | 46.9 | 210.38 a | 6.31 |
| 1w | 7.31 b | 0.67 b | 1.78 | 0.11 | 17.17 | 5.38 | 7.75 | 43.95 | 159.55 b | 6.09 | |
| 2w | 9.66 a | 1.11 a | 1.97 | 0.14 | 18.17 | 5.92 | 8.5 | 42.57 | 202.98 ab | 7.93 | |
| Significance | * | * | NS | NS | NS | NS | NS | NS | * | NS | |
| 3WAT | Control | 19.22 ab | 3.52 | 3.98 | 0.42 | 24.62 ab | 5.68 | 10 | 43.87 | 316.33 | 8.38 |
| 1w | 17.38 b | 3.79 | 3.95 | 0.38 | 23.08 ab | 5.67 | 10.5 | 43 | 303.16 | 9.97 | |
| 2w | 22.17 a | 3.81 | 4.01 | 0.44 | 27.37 a | 6.32 | 10.5 | 41.2 | 321.24 | 8.66 | |
| 3w | 18.68 ab | 3.25 | 4.13 | 0.41 | 20.7 b | 6.07 | 9.75 | 40.28 | 300.37 | 7.93 | |
| Significance | * | NS | NS | NS | * | NS | NS | NS | NS | NS |
xSignificant at *p ≤ 0.05, NS: Not significant. yMeans of four measurements (n = 4) with different letters are significantly different (p ≤ 0.05) by Tukey’s multiple range test). zWAT: Week after transplanting. SFW: Shoot fresh weight; SDW: Shoot dry weight; RFW: Root fresh weight; RDW: Root dry weight.
`
Table 3. Growth parameters of red frill under different salinity stress treatment timing at (1st, 2nd, and 3rd W; 1w, 2w, and 3 w) measured at 1, 2, and 3 weeks after transplanting (WAT).
| Measurement timing | Treatments | SFW (g) | SDW (g) | RFW (g) | RDW (g) | Leaf length (cm) | Leaf width (cm) | Leaf number | Leaf area (cm2) | S/R |
|---|---|---|---|---|---|---|---|---|---|---|
| 1WATz | Control | 3.10y | 0.25 | 0.42 | 0.03 | 14.60 | 5.68 | 9.25 | 25.54 | 8.33 |
| 1w | 2.95 | 0.27 | 0.29 | 0.02 | 14.98 | 5.8 | 9.25 | 33.24 | 13.5 | |
| Significancex | NS | NS | NS | NS | NS | NS | NS | NS | NS | |
| 2WAT | Control | 14.58 | 1.32 | 2.08 | 0.14 | 26.15 | 10.78 | 11.5 a | 155.21 | 9.43 |
| 1w | 15.15 | 1.37 | 3.44 | 0.13 | 25.55 | 11.23 | 10.5 ab | 156.05 | 10.54 | |
| 2w | 12.88 | 1.21 | 1.8 | 0.12 | 25.73 | 10.8 | 9.5 b | 144.63 | 10.08 | |
| Significance | NS | NS | NS | NS | NS | NS | * | NS | NS | |
| 3WAT | Control | 35.88 | 4.67 | 5.17 | 0.41 | .30.40 | 12.65 | 15 ab | 326.92 | 11.39 |
| 1w | 41.37 | 4.97 | 6.16 | 0.55 | 31.63 | 15.86 | 19.25 a | 327.96 | 9.04 | |
| 2w | 37.45 | 4.74 | 5.26 | 0.39 | 32.10 | 14.08 | 11.5 b | 341.10 | 12.15 | |
| 3w | 38.41 | 4.99 | 7.04 | 0.67 | 31.65 | 14.90 | 14.75 ab | 325.20 | 7.45 | |
| Significance | NS | NS | NS | NS | NS | NS | * | NS | NS |
xSignificant at *p ≤ 0.05, NS: Not significant. yMeans (n = 4) with different letters are significantly different (p ≤ 0.05) by Tukey’s multiple range test). zWAT: Week after transplanting. SFW, Shoot fresh weight; SDW, Shoot dry weight; RFW, Root fresh weight; RDW, Root dry weight
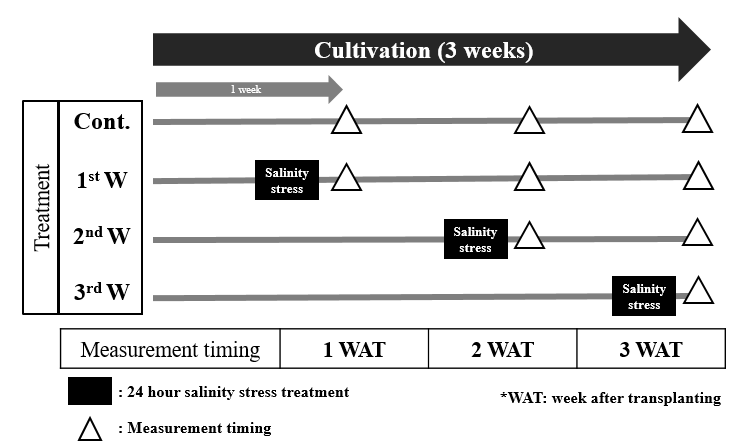
Fig. 1. Experiment process of salinity stress treatments over a 3-week period. NaCl solution (EC 12.6 dS∙m-1) was applied for 24 hours during the 1st, 2nd, and 3rd weeks. Measurements were taken at 1, 2, and 3 weeks after transplanting (WAT), indicated by triangles (△). Black boxes denote the 24-hour salinity stress periods.
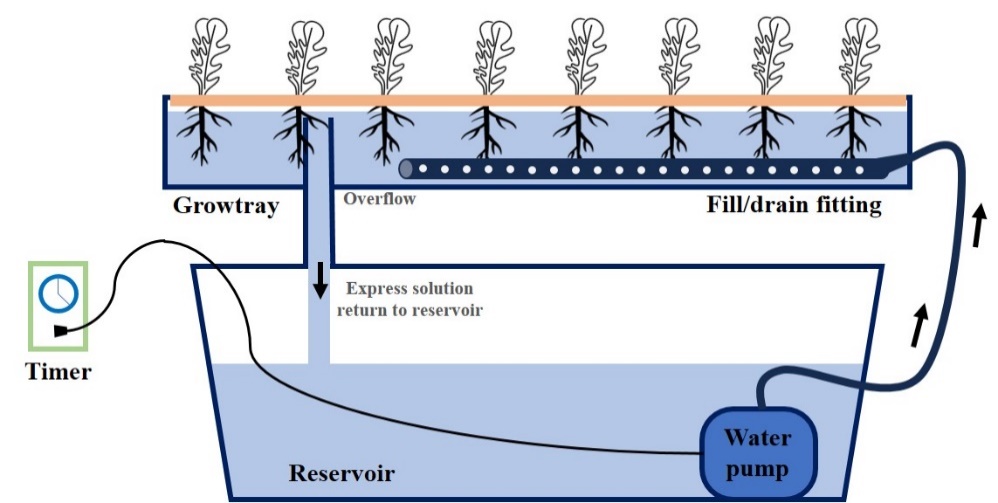
Fig. 2. The ebb and flow system in a rooftop greenhouse. The system consists of a grow tray where plants are cultivated and connected to a reservoir via fill/drain fittings. A water pump, controlled by a timer, circulates the nutrient solution, filling the grow tray and then allowing it to drain back into the reservoir.
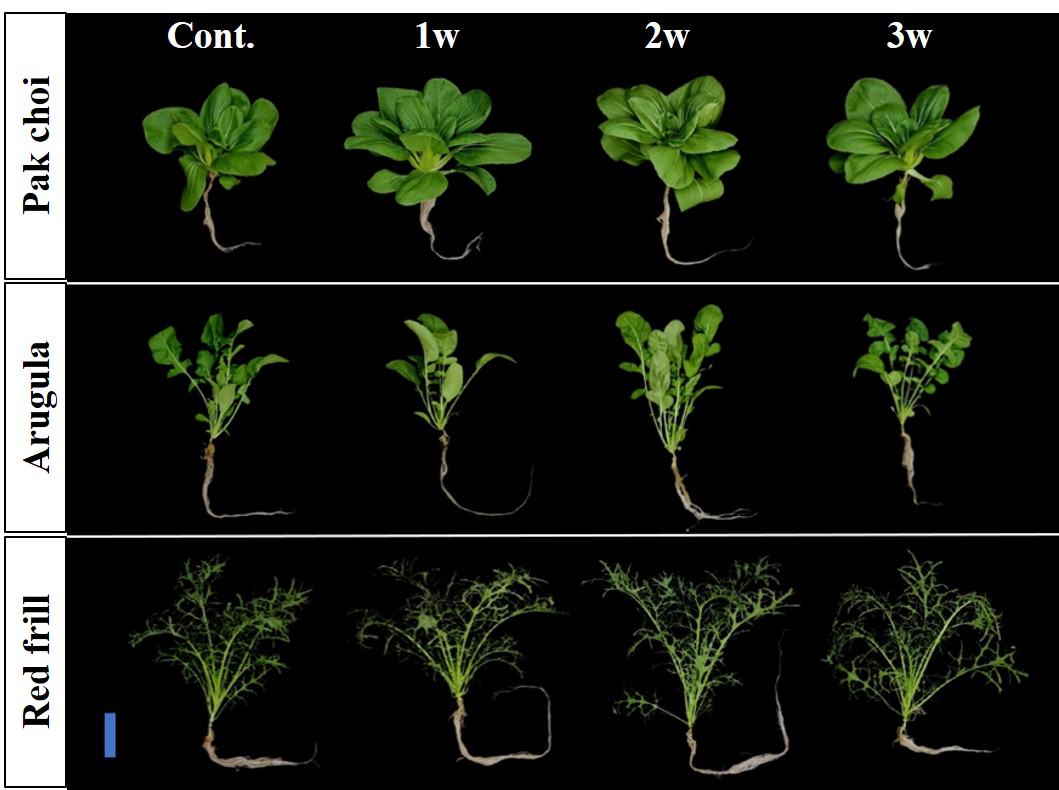
Fig. 3. Images of pak choi (Brassica campestrus L.), arugula (Eruca sativa Mill.), and red frill (Brassica juncea L.) under different salinity stress treatment timing at (1st, 2nd, and 3rd W; 1w, 2w, and 3 w)measured at 3 weeks after transplanting (WAT). Scale bar = 8 cm.
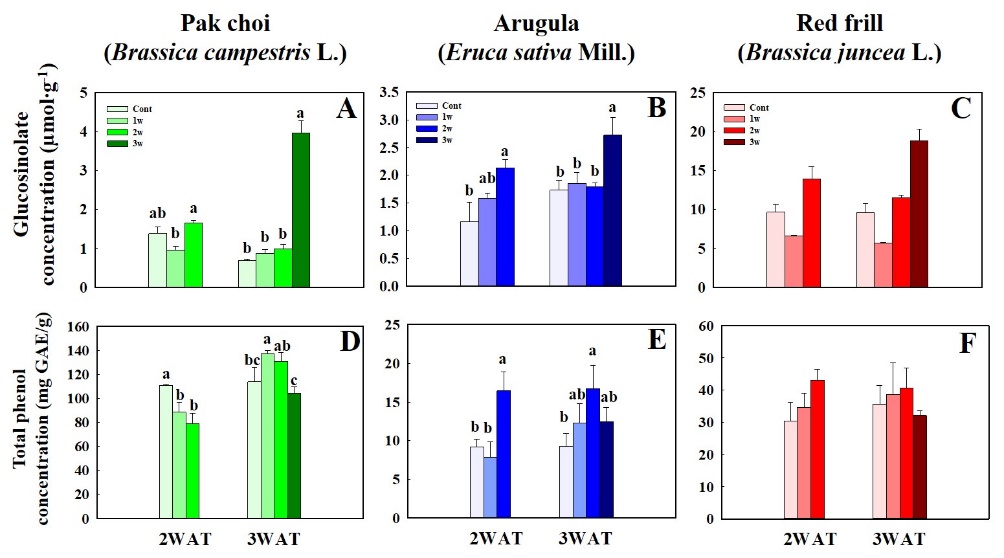
Fig. 4. The total glucosinolate concentration and total phenol concentration of pak choi (Brassica campestrus L.) (A and D), arugula (Eruca sativa Mill.) (B and E), and red frill (Brassica juncea L.) (C and F) under different salinity stress treatment timing at (1st, 2nd, and 3rd W; 1w, 2w, and 3w) measured at 2 and 3 weeks after transplanting (WAT). Data indicate mean ± SE (n = 3). Different letters indicate significant differences (p ≤ 0.05) according to the Tukey´s multiple range test of each treatment.
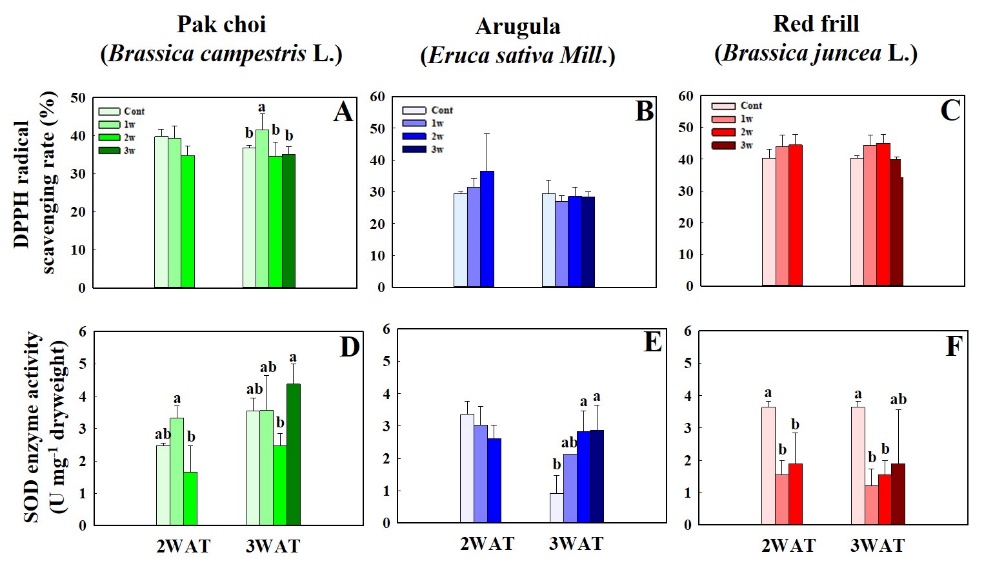
Fig. 5. 2,2-diphenyl-1-picrylhydrazyl radical (DPPH) scavenging rate and superoxide dismutase (SOD) activity of pak choi (Brassica campestrus L.) (A and D), arugula (Eruca sativa Mill.) (B and E), and red frill (Brassica juncea L.) (C and F) under different salinity stress treatment timing at (1st, 2nd, and 3rd W; 1w, 2w, and 3 w) measured at 2 and 3 weeks after transplanting (WAT). Data indicate mean ± SE (n = 3). Different letters indicate significant differences (p ≤ 0.05) according to the Tukey´s multiple range test of each treatment.
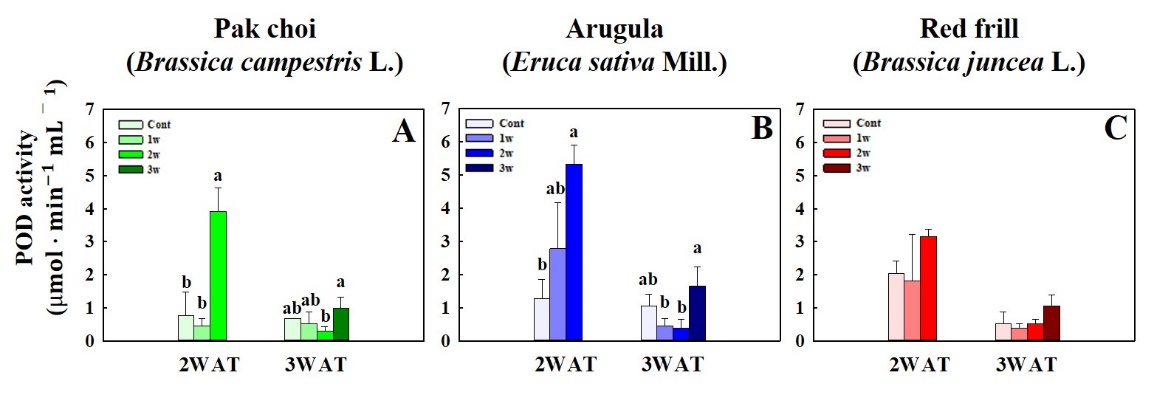
Fig. 6. Peroxidase (POD) vigor of of pak choi (Brassica campestrus L.) (A), arugula (Eruca sativa Mill.) (B), and red frill (Brassica juncea L.) (C) under different salinity stress treatment timing at (1st, 2nd, and 3rd W; 1w, 2w, and 3 w) measured at 2 and 3 weeks after transplanting (WAT). Data indicate mean ± SE (n = 3). Different letters indicate significant differences (p ≤ 0.05) according to the Tukey´s multiple range test of each treatment.