
Aust J Crop Sci. 18(09):598-604 (2024)
ISSN:1835-2707
https://doi.org/10.21475/ajcs.24.18.09.p216
Identification of land fertility and farmer income after an earthquake natural disaster
Bunga Elim Somba*1, Isrun1, Effendy2
1Department of Agroecotechnology, Faculty of Agriculture, Tadulako University, Palu 94118, Indonesia
2Department of Agriculture Economics, Faculty of Agriculture, Tadulako University, Palu 94118, Indonesia
ORCID: https://orcid.org/0009-0006-3922-0707
Abstract
Liquefaction is a phenomenon where saturated sand and silt take on the characteristics of a liquid during the intense shaking of an earthquake. It takes place when a quake has increased water pressure in saturated soil and made particles in the soil lose contact with each other, making the soil, particularly sandy soil, act like a liquid. On September 28, 2018, an earthquake was occurred which caused liquefaction and a tsunami in Central Sulawesi, Indonesia. This incident triggered a new phenomenon, namely liquefaction in several residential areas in Palu City, especially in the Balaroa and Petobo areas. The liquefaction phenomenon in Petobo Village caused changes in the shape of the land surface. The changes that occurred had an impact on decreasing soil fertility levels in the area along with low crop production and decreased farmer incomes. Soil fertility is a quality value of the soil's ability to provide nutrients for growth. This research aims to determine the level of fertility of agricultural land and the amount of farmer income as well as the best efforts to overcome changes in agricultural land after natural disasters. This research used a descriptive method with a population of all farmers living in the Petobo area affected by the earthquake and liquefaction. There were 25 informants who were determined using a purposive sampling technique. Soil samples were analyzed at the Soil Science laboratory, Faculty of Agriculture, Tadulako University, Palu. The method used in this study is a direct survey method in the field, then continued soil sampling at several points according to the coordinate points carried out by purposive sampling techniques. The status of soil chemical properties at 4 sample points affected by liquefaction and 2 sample point not affected by liquefaction in Petobo Village, which classified as very low to very high. Areas affected by liquefaction had neutral to slightly alkaline soil pH content, very low to low C-organic content, very low N-total content, very high P-total content, low K-total content, and have medium to high CEC content. Meanwhile, areas that are not affected by liquefaction had neutral soil pH content, very low to low C-organic content, very low N-total content, very high P-total content, low K-total content, and have medium to high CEC. The low level of soil fertility in this area means that crop production is also low. Changes in the amount of income experienced by affected farmers who initially had around 77.26 USD- 186.71 USD/month declined to 61.16 USD-77.26/month. This is due to changes in the polarization of farmers' work. Actions that can be implemented to increase soil fertility are correct soil management, use of organic fertilizers such as compost, manure, harvest residues such as (legume plant stover, rice straw) and the addition of chemical fertilizers according to the dosage.
Keywords: Land fertility, farmer income, liquefaction, soil physical properties, soil chemical properties.
Abbreviations: CEC_Cation Exchange Capacity; SR_Very low; R_Low; S_Medium; T_High; ST_Very High; USDA_United States Department of Agriculture.
Introduction
The natural disaster in Palu bring out a new phenomenon, which is liquefaction in several residential areas in Palu City, especially in the Balaroa and Petobo areas. Palu is an area that is very vulnerable to liquefaction disasters when earthquakes of very large magnitude shake the area. The danger of liquefaction is caused by earthquakes that changes certain soil characteristics. It results in increase in the pore water pressure of the soil itself (Anamthathmakula and Winuthayanon, 2020; Gowda et al., 2022). As liquefaction progresses, the strength of the soil decreases and the ability of the soil deposit to withstand loads decreases (Zhou et al., 2020). The liquefaction phenomenon that occurs in Palu is unique. Liquefaction that occurs in the Palu area is located in sloping topographic conditions causing the land to flow towards lower ground. It should be noted that 7,901.2 Ha of the Palu City area has a slope of between 15-40 degrees, or in other words, 20% of the Palu City area is included in the steep category.
On September 28, 2018, Petobo, a sub-district in South Palu, was affected by the natural disaster of earthquakes and liquefaction. The length of the liquefaction impact flow in Petobo (Figure 1) is 2,218.2 meters with an area coverage of 182.5 ha. The liquefaction phenomenon in the Petobo area causes changes in the shape of the land surface, so that the original shape of the land is no longer recognized due to the movement of moving soil masses or the occurrence of soil being stirred up. There is also the emergence of new soil material in the form of mud which is now dry. During liquefaction, the soil changes its properties from solid to liquid (Bojadjieva et al., 2022). Basir-Cyio et al. (2021a) described that on agricultural land in Petobo, there is a very high mix. Therefore, the soil horizon profile is difficult to identify. This incident resulted in hundreds of hectares of agricultural land in the Petobo area being lost and damaged.
Soil fertility is a quality value of the soil's ability to provide nutrients for the growth of a type of plant. To determine the level of soil fertility of a land the soil must be analyzed in a laboratory (Amsili et al., 2021). Farmers need scientific information from researchers, in terms of soil fertility and groundwater conditions, to ensure that land affected by liquefaction can still be used for planting (Dong et al., 2023). The changes in agricultural land after the earthquake, liquefaction and tsunami in the Pasigala area may also greatly influence the socio-economic conditions of the community, not only for land owners, but also for sharecroppers. Material and non-material losses can affect people's income levels. Changes in land can result in the loss of sources of income from the agricultural sector, causing farmers to experience difficulties in returning to their agricultural activities (Yulianto et al., 2020). The earthquake and liquefaction had a big impact on the lives of farmers because all agricultural land was badly damaged, having a big impact on people's productivity and farming patterns. Even natural disasters on companies can have impacts on revenues which will experience a drastic decline of up to 50% of the average (Maja and Ayano, 2021).
Results and Discussion
Physical properties
Figure 2. describes that the two areas have similar characteristics because in general they are in the clay and sandy loam classes with a dominance of sand content. The change that occurred is only in the dominance of sandy content in the horizon layer, where in the affected area the dominance of sandy content is mostly found on the top horizon, while in the unaffected area sandy content was mostly found on the bottom horizon. Earthquakes and liquefaction that impact soil composition can cause the upper soil layer to slide to the surface. The forces generated by the earthquake and liquefaction displace the soil, leaving the lower layer undisturbed (Harfian et al., 2020). This shows that the impact of liquefaction that occurred in Petobo did not cause significant changes in the soil texture.
Soil that tends to have a high sand content will have more potential to experience liquefaction because the dominance of sand will cause the space between grains to become larger, so that the bonds between particles are reduced (Bönecke et al., 2021). Earthquake vibrations cause the ground to move so that water in the sand-dominant area will fill the space between the grains more quickly, creating a liquid state that can increase the risk of liquefaction (Wu et al., 2022).
Soil chemical properties
The pH value in Table 1 indicates that, on average, the soil pH content in areas affected by liquefaction, as well as in those not affected, exhibits a slightly alkaline characteristic. The high pH content of the soil in areas affected by liquefaction can be caused by the low water content in the soil, where the lower the water content in the soil, the less the reaction of releasing H+ ions so that the soil becomes alkaline. Various factors greatly affect the pH condition of the soil. These factors include continuous land processing, the use of inorganic fertilizers, lack of soil organic matter, slope, or the influence of surrounding vegetation (López et al., 2018). The pH value of the soil affects the availability of nutrients for plants (Huang and Hartemink, 2020). Plants have certain pH preferences to optimize nutrient absorption (Ghani et al., 2021). Most of the nutrients in plants can dissolve in water at a soil pH range that is close to neutral (pH 6-7). However, at soil pH that falls into very low (acidic) or high (alkaline), the availability of some nutrients can decrease (Bönecke et al., 2021; Wadi et al., 2021).
Meanwhile, it can be seen in Table 2 that the CEC values for both regions are at medium and high levels. TS1, TS2, TS3 lower layer, TS 4, TS5 upper layer, and TS 6 are in the medium criteria. Meanwhile, TS3 upper layer and TS5 lower layer are at high criteria. The relationship between CEC and soil fertility is very important, because CEC plays a key role in providing nutrients to plants. The higher the CEC value, the better the soil fertility (Hau et al., 2020; Huang et al., 2019). Also, high and low CEC values can be influenced by soil texture and organic matter. Soils that have higher clay content and high organic matter have higher CEC values compared to soils with low clay content (sandy soils) and low organic matter levels (Dey et al., 2023). The C-organic values of samples in both areas were in the low (1.00-2.00) and very low (<1.00) criteria with the same variations between the two. The level of agricultural success is greatly influenced by the soil fertility, and the content of organic matter, especially C-Organic carbon (C-organic), plays an important role in increasing soil productivity (Vacante and Kreiter, 2017; Voltr et al., 2021). The C-Organic content acts as an important nutrient source for plants (Sapbamrer and Thammachai, 2021). The results of the nutrient content analysis show that all C-Organic values and K-Total values are in low criteria, while P-Total values show that they are in very high criteria.
Table 2 shows that the P-total content in areas affected by liquefaction and those not affected by liquefaction in Petobo Village does not have a significant difference and has a very high average criterion. The availability of P in the soil is strongly influenced by the pH value. Phosphorus in the soil is present in various forms of compounds that are largely unavailable to plants. Plants usually cannot use most of the fertilizers applied to the soil, because they react with other soil materials. So, the value of P fertilization efficiency is generally low to very low. In neutral pH conditions, the P content is usually also in high criteria because the ion exchange complex is dominated by base cations due to a neutral pH atmosphere. Therefore, nutrient exchange is quite effective because at neutral pH, nutrient availability becomes optimal (Fertahi et al., 2022).
The K2O content in areas affected by liquefaction and those not affected by liquefaction in Petobo Village has low criteria. In areas affected by liquefaction, the lowest K2O content was found in the TS2 (top) sample code of 15.68 mg/100 g, and the highest was found in the TS4 (top) sample code of 20.98 mg/100 g. Meanwhile, in areas that are not affected by liquefaction, the highest total K-content is found in the TS5 (top) sample (17.33 mg/100 g), while the lowest is found in the TS6 (top) sample (11.11 mg/100g). Low K2O content is related to various factors in the soil such as soil acidity and organic matter. Various steps can be taken to increase K in the soil, including applying organic fertilizer to agricultural land. The use of rice straw on agricultural land can increase the presence of potassium in the soil. The main source of potassium in the soil comes from weathering organic matter and fertilizers. Element K in the soil solution results from a balance between the supply from weathered mineral K exchanged at the surface of soil colloids, K from mineralized organic matter or fertilizers, and losses due to plant absorption, retention by soil colloids, and leaching (Sun et al., 2020).
Overall, the results of the analysis show that soil originating from areas affected or not affected by liquefaction, has moderate to high CEC values and very high phosphorus content, but has low potassium and low to very low C-Organic values in the soil. Thus, it can be concluded that soil fertility in this area is relatively low due to the very low organic matter content, resulting in insufficient nutrients for plant growth (Hardie, 2020). Changes in decreasing soil fertility in liquefaction areas can affect the fertility of the surrounding soil, especially those within a radius of less than 1 Km (Teixeira, 2023).
Farmer income changes
Petobo Village has 40 farmer groups with a total of 365 farmers. Changes in the farmers' livelihoods in Petobo Village were occurred after the natural disaster. Before the natural disaster, farmers were actively farming the commodities including cassava, chilli and maize. The average net income of farmers was around 77.26 USD-186.71 USD/month. Meanwhile after occurrence of natural disaster, the farmers income declined drastically in the range of 61.16 USD-77.26 USD/month (1 USD = IDR 15,533).
The factor of decreasing income involves two main aspects, namely changes in employment and decreasing soil fertility. A number of farmers have changed jobs from farming to construction workers and irrelevant jobs because they feel hopeless about the condition of their land. Farmers' decisions to switch jobs after natural disasters reflect adaptation to significant economic and environmental changes, where factors such as economic uncertainty, adaptation limitations, and employment opportunities play an important role in decision making. Some farmers may face time pressures and an urgent need to earn income as quickly as possible, especially if they are facing major losses due to natural disasters (Bao et al., 2021; Basir-Cyio et al., 2021b). As a result, switching jobs is a solution that is considered quicker to meet daily financial needs. Meanwhile, those who still choose to remain farmers, but with very low income due to very low soil fertility so that agricultural yields are not optimal. Natural disasters often cause damage to agricultural land, reducing fertility and soil quality (Widyatmoko et al., 2023). Farmers who initially rely on agricultural products as their main source of income may encounter difficulties in achieving adequate results (Dubbert, 2019). Infertile soil conditions make agriculture less productive and no longer guarantee adequate income (Guo et al., 2022; Handayani and Winara, 2020).
Materials and methods
Soil sampling
Soil sampling was carried out using the purposive sampling technique, namely a soil sampling technique that takes into account field conditions in accordance with the research objectives so that it is hoped that it can answer research problems (Angst et al., 2021). The soil samples were incomplete soil samples and taken in strips at the sampling location. The coordinate points for taking soil samples were recorded using GPS. There are 6 sample points determined on soil that is not or is affected by liquefaction. Then soil samples were taken at a depth of 20 cm and 40 cm. So 12 soil samples were obtained which were then analyzed at the Environmental Natural Resources Analysis Laboratory, Faculty of Agriculture, Tadulako University. Soil sampling is presented in Table 3.
Soil physical analysis
Determining soil texture in the laboratory is usually done using the pipette method. This method is based on Stokes' law which states that the falling or settling speed of spherical grains is a function of the size or diameter of the grains. Soil texture analysis can use the soil texture classification system according to the USDA (United States Department of Agriculture). Soil texture classes according to USDA can be divided into 12 soil texture classes, namely sand (S), clayey sand (LS), sandy loam (SL), clay (L), dusty clay (SiL), silt (Si), clayey clay (CL), sandy clay loam (SCL), dusty clay loam (SiCL), sandy clay (SC), dusty clay (SiC) and clay (C). Determining texture using the texture triangle is presented in Figure 3.
Soil chemical analysis
Soil reaction (Soil pH)
The way to determine soil pH is by using a soil and extractor ratio of 1:5. The initial step is to weigh 10.00 g of soil sample twice, put each into a shake bottle, add 50 ml of ion-free water to one bottle (pH H2O) and 50 ml of 1 M KCl into the other bottle (pH KCl). Beat with a whisk for 30 minutes. The soil suspension was measured with a pH meter that had been calibrated using a buffer solution of pH 7.0 and pH 4.0. Report the pH value to one decimal.
Cation exchange capacity
The way to determine CEC is to weigh 1 gram of air-dry soil sample that passes through a 0.5 mm sieve and put it in a container/beaker/plastic bottle. Add 25 ml of NH4OAc 1N pH 7.0 solution and stir with a stir stick and let stand overnight. Filter with filter paper in a funnel and tamp the filtrate with another container. Transfer all the soil to a filter paper bottle by rinsing the remaining soil with NH4OAc solution using a plastic spray bottle or measuring pipette. Wash the soil on filter paper with 20 – 30 ml of NH4OAc solution and leave it until it drains completely. Repeat washing several times. Wash the soil on filter paper with 25 – 30 ml of ethanol/alcohol for each wash. Let it drain completely before repeating washing 2 – 3 times. Transfer the soil and filter paper into an 800 ml Kjedahl flask then add 200 ml of distilled water. Pipette 25 ml H3BO3 into a 250 ml Erlemeyer. Place the kjedahl flask containing the soil sample and the Erlemeyer containing H3BO3 in the distillation apparatus and begin distillation until the distillate accommodated in the Erlemeyer reaches 100 – 150 ml. Remove the flask and titrate with 0.1 N HCl solution until the green color changes to pink. Use a blank by distilling distilled water with the same reagent as the soil sample. KTK can be calculated using the following formula:
CEC (mg/100g of soil) = t – bx N HCl x$\frac{100}{W}$
Where; t is the volume of HCl for the sample titar (ml), N is the normality of HCl, and b is the volume of HCl for the blank titar (ml), while W is the weight of the soil sample.
C-organic
C-Organic can be determined by weighing 0.5 grams of soil sample that passes through a 0.5 mm sieve (0.05 – 0.1 grams for organic soil/peat) and placing it in a 250 ml Erlemeyer. Add 5 ml K2Cr2O7 1N while shaking, then add 10 ml H2SO4 and shake slowly. After mixing completely, the solution is allowed to sit for 20 – 30 minutes. Add 100 ml distilled water, 5 ml NaF, 5 ml H3PO4 and 15 drops of diphenylamine indicator. Titrate the solution with 0.5 N Ferrous ammonium sulfate or 1 N Ferrous sulfate. In the initial stage the chromium ion is black, purplish and the end point of the titration is bright green. Do the same method and the same time for the blank. C-Organic calculations can use the formula:
%C-Organic =$\frac{mlFeSO4\ (Blanko - soil\ sample)}{Weight\ of\ soil\ sample}\ x\ NFeSO4\ x\ \frac{0.30}{0.77}$
N-Total
The way to determine N-total is by carefully weighing 1,000 g of soil sample into a digestion tube, adding 10 ml of concentrated H2SO4 and ± 2 g of selen/catalyst mixture or the tip of a teaspoon, carrying out a blank determination. Heat/destroy for 1 1⁄2 hours, then distill by adding 35 ml of 40% NaOH, collect the distillate in 25 ml of boric acid. Distillation ends when the volume of distillate in the container has reached 50-75 ml. The distillate is titrated with a standard acid solution, namely H2SO4 0.05 N or HCl 1 N until the end point is the color change from green to pink. The equation for calculating N-total is as follows:
$$N(\%) = \ \frac{14.01\ x\ (sample\ titration - blanko\ titration)x\ N\ HCl}{Weight\ of\ soil\ sample\ x\ 10}$$
P-Total
The way to determine P2O5 of 25% HCl extract is by carefully weighing 2 grams of ground soil sample (passing a 2 mm sieve) and placing it in a shake bottle (film roll). Add 10 ml of 25% HCl solution using a measuring pipette or 10 ml volume pipette. Shake for 30 minutes (leave for 1 x 24 hours) then filter using filter paper and collect the solution/filtrate. Pipette 0.5 ml of solution/filtrate into a test tube then add 2 ml of distilled water (5x dilution) and shake with a vortex until homogeneous. Next, pipette the solution and the P standard series as much as 1 ml each into a test tube. Add 5 ml of mixed reagent each, shake with a vortex until homogeneous then measure with a spectrophotometer at a wavelength of 693 nm with a standard P series as a comparison.
$$\% P_{2}O_{5}\ Total = ppm\ curve\ x\ \left( \frac{ml\ ekstract}{1000} \right)x\ \left( \frac{100\ mg}{Weight\ of\ soil\ sample} \right)x\ fp\ x\ \left( \frac{142}{90} \right)x\ fk$$
K-Total
Carefully weigh 2 grams of ground soil sample (passing a 2 mm sieve) and put it in a shake bottle (film roll). Add 10 ml of 25% HCl solution using a measuring pipette or 10 ml volume pipette. Shake for 30 minutes (leave for 1 x 24 hours) then filter using filter paper and collect the solution/filtrate. Pipette 0.5 ml of solution/filtrate and add 9.5 ml of distilled water (20 x dilution), shake with a vortex until homogeneous then measure with a flame photometer/flame photometer with a standard K series as a comparison. The K-total calculation uses the following formula:
$$\% K_{2}O\ Total = ppm\ curve\ x\ \left( \frac{ml\ ekstract}{1000} \right)x\ \left( \frac{100\ mg}{Weight\ of\ soil\ sample} \right)x\ fp\ x\ \left( \frac{142}{90} \right)x\ fk$$
Changes in farmer income
The farmers who became informants were selected purposively, namely those who had been farming before the natural disaster. Data on changes in farmers' income was obtained using direct interviews with farmers affected by the liquefaction natural disaster by asking several questions regarding income and employment before the disaster, as well as income and employment after the disaster. Then an analysis was carried out on the results of open interviews with a number of key informants.
Conclusion
We concluded that the status of soil fertility in areas both affected and not affected by liquefaction in Petobo Village are classified as low. Areas affected by liquefaction have neutral to slightly alkaline soil pH content, very low to low C-organic content, very low N-total content, very high P-total content, low K-total content, and medium to high CEC content. Meanwhile, areas that are not affected by liquefaction have neutral soil pH content, very low to low C-organic content, very low N-total content, very high P-total content, low K-total content, and medium to high CEC content. The level of soil fertility is the main cause of changes in the polarization of farmers' livelihoods which also has a significant effect on decreasing farmer incomes. Efforts that can be applied to increase soil fertility include proper soil management, use of organic fertilizers such as compost, manure, harvest residues such as (legume plant stover, rice straw) and adding chemical fertilizers according to the dosage.
Reference
Amsili JP, Van Es HM, Schindelbeck RR (2021) Cropping system and soil texture shape soil health outcomes and scoring functions. Soil Security. 4: 100012. https://doi.org/10.1016/j.soisec.2021.100012
Anamthathmakula P, Winuthayanon W (2020) Mechanism of semen liquefaction and its potential for a novel non-hormonal contraception†. Biology of Reproduction. 103(2): 411–426. https://doi.org/10.1093/biolre/ioaa075
Angst G, Pokorný J, Mueller CW, Prater I, Preusser S, Kandeler E, Meador T, Straková P, Hájek T, Van Buiten G, Angst Š (2021) Soil texture affects the coupling of litter decomposition and soil organic matter formation. Soil Biology and Biochemistry. 159: 108302. https://doi.org/10.1016/j.soilbio.2021.108302
Bao X, Zhang F, Deng X, Xu D (2021) Can Trust Motivate Farmers to Purchase Natural Disaster Insurance? Evidence from Earthquake-Stricken Areas of Sichuan, China. Agriculture. 11(8): 783. https://doi.org/10.3390/agriculture11080783
Basir-Cyio M, Anshary A, Mahfudz M, Isrun I, Napitupulu M, Fadhliah F (2021) Sustaining farmers life affected by the natural disaster; an implication during the covid-19 pandemic [Preprint]. In Review. https://doi.org/10.21203/rs.3.rs-263089/v1
Basir-Cyio M, Mahfudz, Isrun, Zeffitni (2021a) The impact of liquefaction disaster on farming systems at agriculture land based on technical and psychosocial perspectives. PLOS ONE. 16(1): e0245591. https://doi.org/10.1371/journal.pone.0245591
Bojadjieva J, Sheshov V, Edip K, Kitanovski T (2022) Verification of a System for Sustainable Research on Earthquake-Induced Soil Liquefaction in 1-g Environments. Geosciences. 12(10): 363. https://doi.org/10.3390/geosciences12100363
Bönecke E, Meyer S, Vogel S, Schröter I, Gebbers R, Kling C, Kramer E, Lück K, Nagel A, Philipp G, Gerlach F, Palme S, Scheibe D, Zieger K, Rühlmann J (2021) Guidelines for precise lime management based on high-resolution soil pH, texture and SOM maps generated from proximal soil sensing data. Precision Agriculture. 22(2): 493–523. https://doi.org/10.1007/s11119-020-09766-8
Dey S, Purakayastha TJ, Sarkar B, Rinklebe J, Kumar S, Chakraborty R, Datta A, Lal K, Shivay YS 2023 Enhancing cation and anion exchange capacity of rice straw biochar by chemical modification for increased plant nutrient retention. Science of The Total Environment 886 163681
Dong CX, Duan Z, Li R, Li J, Li H, Wang N, Peng J, Chen X (2023) Impact liquefaction mechanism of sandy silt with a change in impact energy. Quarterly Journal of Engineering Geology and Hydrogeology. 56(3): qjegh2022-122. https://doi.org/10.1144/qjegh2022-122
Dubbert C (2019) Participation in contract farming and farm performance: Insights from cashew farmers in Ghana. Agricultural Economics. 50(6): 749–763. https://doi.org/10.1111/agec.12522
Fertahi S, Pistocchi C, Daudin G, Amjoud M, Oukarroum A, Zeroual Y, Barakat A, Bertrand I 2022 Experimental dissolution of biopolymer-coated phosphorus fertilizers applied to a soil surface: Impact on soil pH and P dynamics. Annals of Agricultural Sciences. 67: 189–95
Ghani S, Kumari S, Bardhan A (2021) A novel liquefaction study for fine-grained soil using PCA-based hybrid soft computing models. Sādhanā. 46(3): 113. https://doi.org/10.1007/s12046-021-01640-1
Gowda GMB, Dinesh SV, Govindaraju L, Ramesh Babu R (2022) Effect of Liquefaction Induced Lateral Spreading on Seismic Performance of Pile Foundations. Civil Engineering Journal. 7: 58–70. https://doi.org/10.28991/CEJ-SP2021-07-05
Guo Z, Li P, Yang X, Wang Z, Lu B, Chen W, Wu Y, Li G, Zhao Z, Liu G, Ritsema C, Geissen V, Xue S (2022) Soil texture is an important factor determining how microplastics affect soil hydraulic characteristics. Environment International. 165: 107293. https://doi.org/10.1016/j.envint.2022.107293
Handayani W, Winara A (2020) Diversity Of Soil Macrofauna On Several Land Use On Peatlands. Jurnal Agroforestri Indonesia. 3(2): 77–88. https://doi.org/10.20886/jai.2020.3.2.77-88
Hardie M (2020) Review of Novel and Emerging Proximal Soil Moisture Sensors for Use in Agriculture. Sensors. 20(23): 6934. https://doi.org/10.3390/s20236934
Harfian I, Muchtar NM, Mardiana FNF, Ishak ABL, Munier FF 2020 Analisis Perubahan Sifat Fisik dan Kimia Tanah Pasca Gempa, Likuifaksi, dan Tsunami di Wilayah Kota Palu, Kabupaten Sigi, dan Donggala Sulawesi Tengah. In Prosiding Seminar Nasional, Digitalisasi Pertanian Mendukung Ketahanan Pangan Era Revolusi Industri 4.0 pp 143-154
Hau LJ, Shamsuddin R, May AKA, Saenong A, Lazim AM, Narasimha M, Low A (2020) Mixed Composting of Palm Oil Empty Fruit Bunch (EFB) and Palm Oil Mill Effluent (POME) with Various Organics: An Analysis on Final Macronutrient Content and Physical Properties. Waste and Biomass Valorization. 11(10): 5539–5548. https://doi.org/10.1007/s12649-020-00993-8
Huang J, Hartemink AE (2020) Soil and environmental issues in sandy soils. Earth-Science Reviews. 208: 103295. https://doi.org/10.1016/j.earscirev.2020.103295
Huang R, McGrath SP, Hirsch PR, Clark IM, Storkey J, Wu L, Zhou J, Liang Y (2019) Plant–microbe networks in soil are weakened by century‐long use of inorganic fertilizers. Microbial Biotechnology. 12(6): 1464–1475. https://doi.org/10.1111/1751-7915.13487
López VR, Yustres A, Asensio L, Saez C, Cañizares P, Rodrigo MA, Navarro V (2018) Enhanced electrokinetic remediation of polluted soils by anolyte pH conditioning. Chemosphere. 199: 477–85.
Maja MM, Ayano SF (2021) The Impact of Population Growth on Natural Resources and Farmers’ Capacity to Adapt to Climate Change in Low-Income Countries. Earth Systems and Environment. 5(2): 271–283. https://doi.org/10.1007/s41748-021-00209-6
Sapbamrer R, Thammachai A (2021) A Systematic Review of Factors Influencing Farmers’ Adoption of Organic Farming. Sustainability. 13(7): 3842. https://doi.org/10.3390/su13073842
Sun F, Ou Q, Wang N, Guo Z X, Ou Y, Li N, Peng C 2020 Isolation and identification of potassium-solubilizing bacteria from Mikania micrantha rhizospheric soil and their effect on M. micrantha plants. Global Ecology and Conservation. 23: e0114
Teixeira F (2023) A mechanism to explain soil liquefaction environmental effects during an earthquake [Preprint]. In Review. https://doi.org/10.21203/rs.3.rs-3088285/v1
Vacante V, Kreiter S (Eds.) (2017) Handbook of pest management in organic farming. CABI.
Voltr V, Menšík L, Hlisnikovský L, Hruška M, Pokorný E, Pospíšilová L (2021) The Soil Organic Matter in Connection with Soil Properties and Soil Inputs. Agronomy. 11(4): 779. https://doi.org/10.3390/agronomy11040779
Wadi D, Wu W, Malik I, Ahmed HA, Makki A (2021) Assessment of liquefaction potential of soil based on standard penetration test for the upper Benue region in Nigeria. Environmental Earth Sciences. 80(7): 254. https://doi.org/10.1007/s12665-021-09565-y
Widyatmoko A, Legono D, Hardiyatmo HC (2023) Liquefaction potential analysis around sediment control structure of Paneki River, Central Sulawesi. 030018. https://doi.org/10.1063/5.0133260
Wu Q, Ding X, Zhang Y (2022) Microfabric evolution of coral sand foundations during seismic liquefaction using 3D images. Soil Dynamics and Earthquake Engineering. 162: 107445. https://doi.org/10.1016/j.soildyn.2022.107445
Yulianto E, Utari P, Satyawan IA (2020) Communication technology support in disaster-prone areas: Case study of earthquake, tsunami and liquefaction in Palu, Indonesia. International Journal of Disaster Risk Reduction 45: 101457. https://doi.org/10.1016/j.ijdrr.2019.101457
Zhou YG, Xia P, Ling DS, Chen YM (2020) Liquefaction case studies of gravelly soils during the 2008 Wenchuan earthquake. Engineering Geology. 274: 105691. https://doi.org/10.1016/j.enggeo.2020.105691
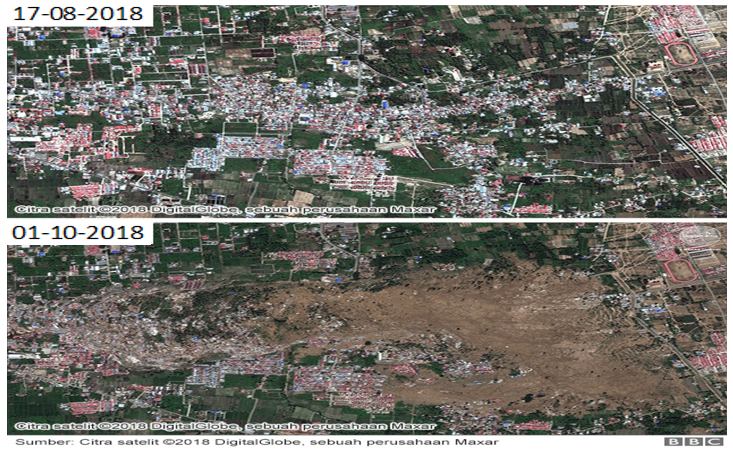
Figure 1. Petobo Village taken by satellite image before and after the liquefaction in 2018.
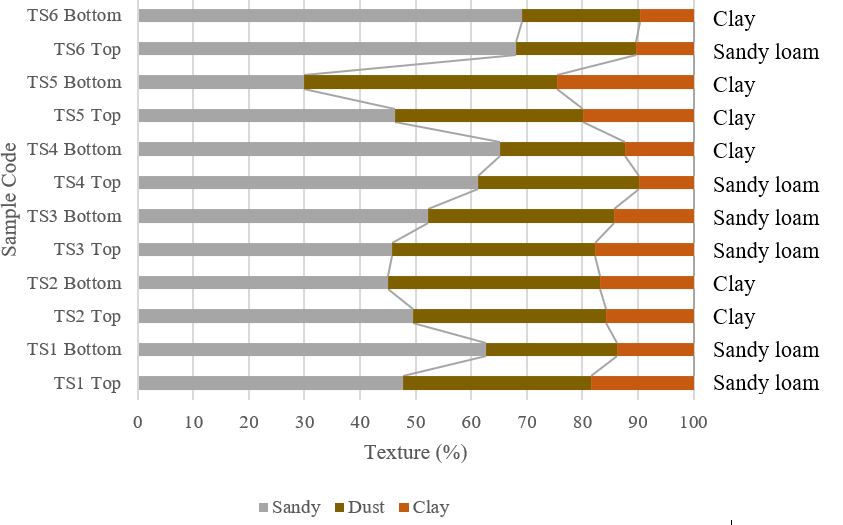
Figure 2. Soil texture analysis in the liquefaction area in Petobo Village.
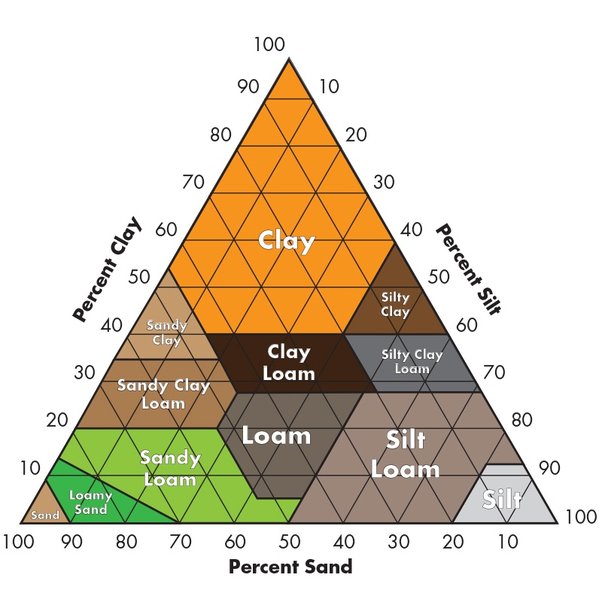
Figure 3. Soil texture triangle.
Table 1. Data from analysis of soil pH, CEC, C-organic and nutrient elements (NPK) in liquefaction areas in Petobo Village.
| Sample Code | PH | CEC (mg/100 g) |
C-Organic (%) |
Nutrient | ||
|---|---|---|---|---|---|---|
N-Total (%) |
P2O5 (mg/100 g) |
K2O (mg/100 g) |
||||
| TS1 (top) | 7.13 | 20.33 | 1.51 | 0.04 | 70.79 | 18.00 |
| TS1 (bottom) | 7.29 | 21.42 | 1.19 | 0.06 | 64.61 | 16.55 |
| TS2 (top) | 7.38 | 22.57 | 1.29 | 0.04 | 69.46 | 15.68 |
| TS2 (bottom) | 7.46 | 18.61 | 1.10 | 0.03 | 64.64 | 19.92 |
| TS3 (top) | 7.35 | 25.34 | 1.07 | 0.02 | 63.10 | 19.04 |
| TS3 (bottom) | 7.35 | 19.38 | 0.56 | 0.01 | 66.38 | 16.55 |
| TS4 (top) | 7.56 | 19.74 | 0.61 | 0.01 | 67.22 | 20.98 |
| TS4 (bottom) | 7.53 | 19.25 | 0.77 | 0.02 | 64.83 | 19.60 |
| TS5 (top) | 5.72 | 20.91 | 0.67 | 0.04 | 64.85 | 17.33 |
| TS5 (bottom) | 6.71 | 31.81 | 1.74 | 0.02 | 65.31 | 16.27 |
| TS6 (top) | 5.58 | 23.32 | 1.29 | 0.04 | 67.34 | 11.11 |
| TS6 (bottom) | 5.86 | 17.03 | 0.72 | 0.03 | 63.96 | 15.79 |
Note: TS1 – TS4 are samples in affected areas, TS5 – TS6 are samples in unaffected areas
Table 2. Soil Chemical properties assessment based on soil fertility status analysis.
|
|
|
|
|
|---|---|---|---|---|
|
|
|
|
|
|
|
|
|
|
|
|
|
|
|
|
|
|
|
|
|
|
|
|
|
|
|
|
|
|
|
|
|
|
|
|
|
|
|
|
|
|
|
|
|
|
|
|
|
|
|
|
|
|
|
|
|
|
|
|
Note: SR = Very low; R = Low; S = Medium; T = High ; ST = Very High
Table 3. Soil sampling points.
| Sample Code | Point coordinate | |
|---|---|---|
| Latitude (LS) | Longitude (BT) | |
| TS1 | 0°56'18.938"S | 119°54'21.449"E |
| TS2 | 0°56'23.078"S | 119°54'48.89"E |
| TS3 | 0°56'31.963"S | 119°55'15.145"E |
| TS4 | 0°56'11.533"S | 119°55'4.013"E |
| TS5 | 0°55'55.923"S | 119°54'50.663"E |
| TS6 | 0°55'58.229"S | 119°54'21.039"E |
Note: TS1 – TS4 are samples in affected areas, TS5 – TS6 are samples in unaffected areas.