
Aust J Crop Sci. 19(02):199-205 (2025) | ISSN:1835-2707
https://doi.org/10.21475/ajcs.25.19.02.p292
Effect of biochar application on growth, physiology and yield of soybean [Glycine max (L.) Merrill] under salt stress
Van-Giang Tong 1, Thi-Huyen Tran 1, Thi-Lan-Huong Hoang 2, Trong-Truong-Son Nguyen 3, Dong-Cheol Jang 4, The-Khuynh Bui 5, Thi-Tuyet-Cham Le 5, Ngoc-Thang Vu 5,* and Ngoc-Lan Vu 5,*
1Faculty of Agriculture, Forestry, and Fisheries, Hong Duc University, Thanh Hoa, 440000, Vietnam
2Plant Resources Center, Vietnam Academy of Agricultural Sciences, Hanoi, 131000, Vietnam
3Hanoi University of Natural Resource and Environment, Hanoi, 131000, Vietnam
4Department of Horticulture, Kangwon National University, Chuncheon 24341, Korea
5Faculty of Agronomy, Vietnam National University of Agriculture, Hanoi, 131000, Vietnam
*Corresponding author: Ngoc-Thang
Vu 
*Corresponding author: Ngoc-Lan Vu
Abstract: A pot study was conducted to understand the effects of biochar on the growth, physiology, and yield of soybean under salt stress. Different biochar application rates (0, 5, 10, 15, and 20 tons ha-1) were applied to the soil before soybean seeds were sown into pots. Salinity treatment was applied at the flowering stage by irrigating soybean plants with 100 ml of NaCl (100 mM) once every 3 days. The treatment lasted 30 days, and a total of 1000 ml of NaCl solution was applied to each pot. Salinity significantly decreased the growth and yield of soybean. Biochar application at 10 tons ha-1 significantly increased the growth and yield components including root length, leaf area, plant fresh and dry weight, nodule number plant-1, Fv/Fm, leaf chlorophyll content, pod number plant-1, 100-seed weight, and grain yield whereas the leaves' relative ion leakage and water saturation deficit both decreased. Our findings suggested the application of 10 tons ha-1 biochar can promote an optimal growth, physiology and high yield of soybean.
Keywords: biochar, growth, physiology, salt stress, soybean, yield.
Introduction
The global estimates from various scientists reported that around 1 billion hectares of land are affected by salinity in the world (Qadir et al., 2014; Dagar and Minhas, 2016; Shahid et al., 2018). Particularly, in arid and semi-arid areas, salt-affected soils are widely and extensively distributed (with more than 100 countries) (Saifullah et al., 2018). As most of the crops are highly sensitive and vulnerable to the high concentration of salts in soil, salinity has become one of the most severe abiotic factors which negatively affect crop productivity worldwide (Shrivastava and Kumar, 2015).
Biochar is a carbon-rich material produced from pyrolyzing biomass in a confined container with limited O2 (Lehmann and Joseph, 2015). Recently, the use of biochar as an effective soil amendment has gained a lot of attention (Saifullah et al., 2018). Many studies have shown that biochar application on the salt-affected soils is effective in improving physical, chemical and biological properties (Saifullah et al., 2018; Thomas et al., 2013; Chaganti and Crohn, 2015; Kim et al., 2016; Akhtar et al., 2015; Amini et al., 2016; Ali et al., 2017). One of the direct influences of biochar is that it helps to decrease Na+ absorption; thereby, enhancing the availability of other essential nutrients such as K+ in the soil (Chintala et al., 2014). Thus, biochar has been shown in numerous studies to enhance crop productivity and soil quality in a variety of agricultural soils (Huang et al., 2013; Lashari et al., 2013). For example, Xu et al. (2015) stated that yield of groundnuts significantly increased in the soils treated with biochar. Chintala et al. (2014) and Akhtar et al. (2014) noted the positive effects of biochar as seen by the increase in soil water holding capacity, enhanced plant physiological responses including leaf chlorophyll content, leaf relative water content, stomatal conductance, and photosynthetic capacity. Vu et al. (2023) revealed the positive influences of biochar on growth and physiology of sugarcane subjected to a salinity stress at an early growth stage. In addition, Farhangi-Abriz and Torabian (2018) found that nodulation as well as nitrogen metabolism in soybean treated with biochar was improved under salt stress.
Soybean [Glycine max (L.) Merrill] is one of the most important food and oil crops with a great source of edible oil and vegetable protein (Guo et al., 2022). Despite being a crop with high adaptation to a wide range of soils and climates, soybean is considered as a salt-sensitive crop (Luo et al., 2005), as shown by its high sensitivity to saline conditions. Several studies have reported that growth characteristics and yield of soybean reduced significantly in saline conditions (Talib and Dawood, 2001; Katerji et al., 2003; Hamayun et al., 2010; Khan et al., 2016). Although soybean is a valuable crop, its high sensitivity to salinity has limited its production globally, including in Vietnam. Therefore, additional studies are required to deepen our understanding of the roles of biochar in minimizing the detrimental effects caused by salinity on the growth and yield of soybean.
Results
Effect of biochar on growth characteristics of soybean
Effect of biochar rates on plant height, root length and leaf area
Salinity significantly decreased soybean growth-related characteristics including root length and leaf area. However, there was no statistical differences in plant height between non-salt stress and salt stress conditions. Biochar application
Table 1. Plant height, root length and leaf area of soybean in response to different rates (0, 5, 10, 15, and 20 tons ha-1) of biochar application under non-salt stress and salt stress.
| Treating condition | Biochar rate (tons ha-1) |
Plant height (cm) |
Root length (cm) |
Leaf area (dm2 plant-1) |
|---|---|---|---|---|
| Non-salt stress | 0 | 51.70 b | 28.53 bc | 5.97 c |
| 5 | 52.03 b | 29.53 bc | 6.60 bc | |
| 10 | 55.40 a | 31.77 a | 8.00 a | |
| 15 | 53.15 ab | 29.80 b | 7.37 ab | |
| 20 | 52.80 b | 29.67 b | 6.95 b | |
| Salt stress | 0 | 50.60 b | 26.10 c | 4.58 d |
| 5 | 50.83 b | 26.48 c | 4.88 d | |
| 10 | 53.74 ab | 28.63 bc | 6.75 b | |
| 15 | 52.03 b | 27.67 c | 5.97 c | |
| 20 | 51.88 b | 27.53 c | 5.43 c | |
| CV% | 3.4 | 4.7 | 9.1 | |
| LSDTxB 0.05 | 2.55 | 1.92 | 0.96 | |
| Average of treating condition | Non-salt stress | 53.02 A | 29.86 A | 6.98 A |
| Salt stress | 51.81 A | 27.28 B | 5.52 B | |
| LSDT 0.05 | 1.28 | 0.86 | 0.43 | |
| Average of biochar rates | 0 | 51.15 B | 27.31 C | 5.27 C |
| 5 | 51.43 B | 28.00 BC | 5.74 C | |
| 10 | 54.57 A | 30.20 A | 7.38 A | |
| 15 | 52.59 B | 28.73 B | 6.67 B | |
| 20 | 52.34 B | 28.60 BC | 6.19 BC | |
| LSD B 0.05 | 1.87 | 1.36 | 0.68 | |
CV: Coefficient of Variation; LSD: Least significant difference; T: Treating conditions (non-salt stress and salt stress); B: Biochar rates. Mean within a column followed by the same lowercase letters are not significantly different among biochar rates and treating conditions at p ≤ 0.05. Mean within a column followed by the same capital letters are not significantly different among biochar rates or not significantly different between treating conditions by Duncan’s multiple range tests at p ≤ 0.05.
improved growth characteristics such as plant height, root length and leaf area of soybean in both non-salt stress and salt stress conditions. However, there was no statistical differences in plant height among soybean plants applied with 0, 5, 15, and 20 tons of biochar ha-1 or in root length and leaf area among soybean plants applied with 0, 5, and 15 tons of biochar ha-1 (Table 1). The highest values of plant height, root length and leaf area were recorded in soybean plants treated with a rate of 10 tons of biochar ha-1.
Effects of biochar rates on plant fresh and dry weight of soybean
Plant fresh and dry weight of soybean were significantly declined under the salt stress. However, biochar application significantly increased the fresh and dry weight of roots, shoots and leaves of soybean growing under both non-salt stress and salt stress conditions. The highest values of fresh and dry weight of roots, shoots and leaves of soybean were found in soybean plants treated with 10 tons of biochar ha-1 (Table 2).
Effect of biochar on physiological characteristics of soybean
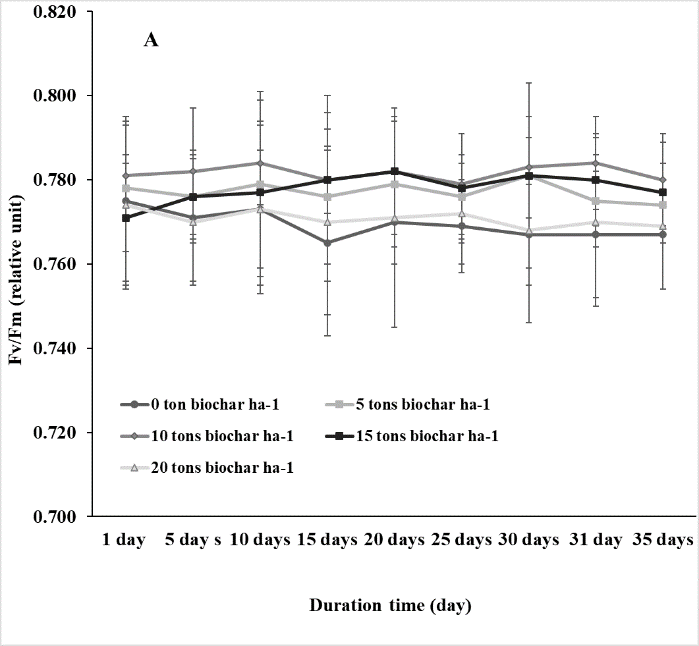
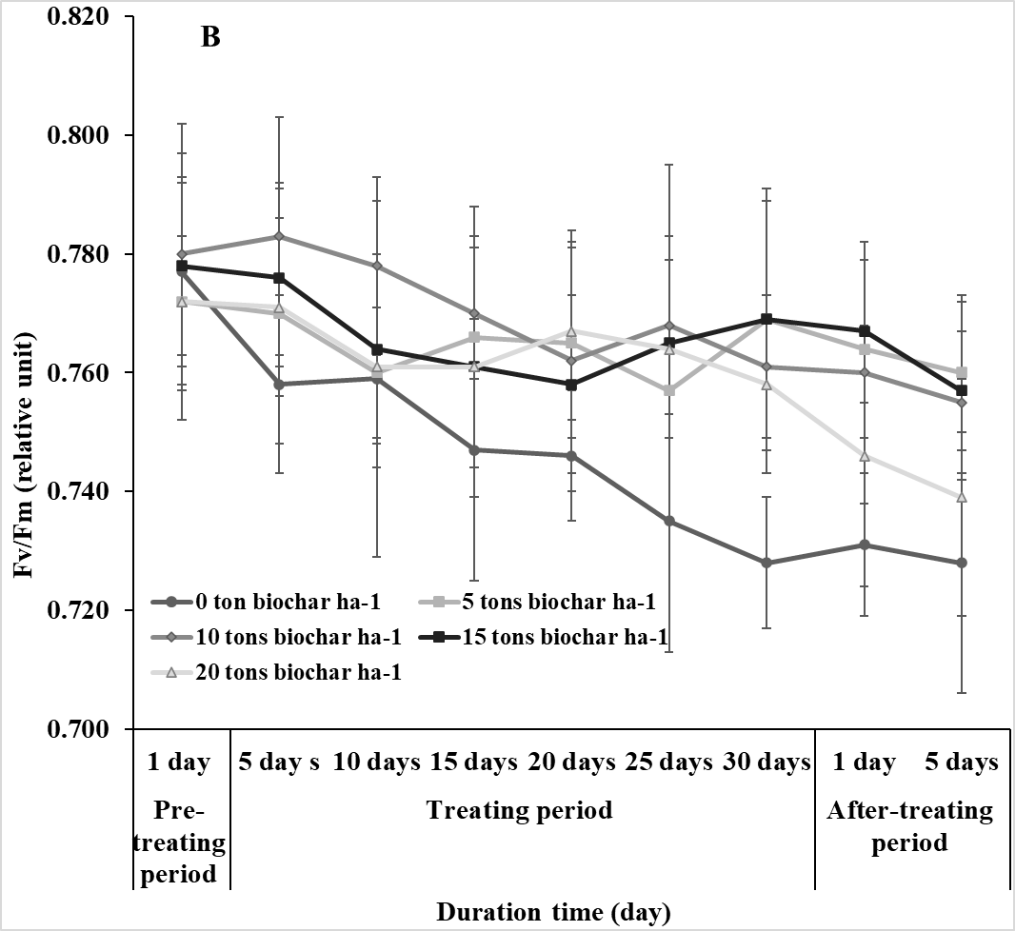
Effect of biochar rates on photosynthetic efficiency (Fv/Fm)
The changes in photosynthetic efficiency (Fv/Fm) of soybean from pre-treating to after treating periods of saline conditions were measured to examine the effect of salinity on physiological performance. Fv/Fm of soybean was significantly affected by salinity and decreased after the saline stress treatment. Biochar application improved Fv/Fm of soybean in saline condition. However, no significant difference in Fv/Fm of soybean was found among the plants treated with 5, 10, 15, and 20 tons of biochar ha-1 (Fig. 1).
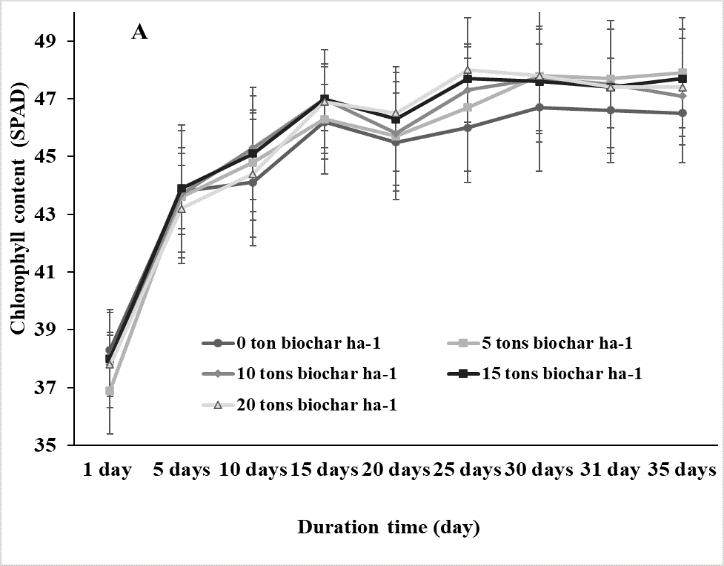
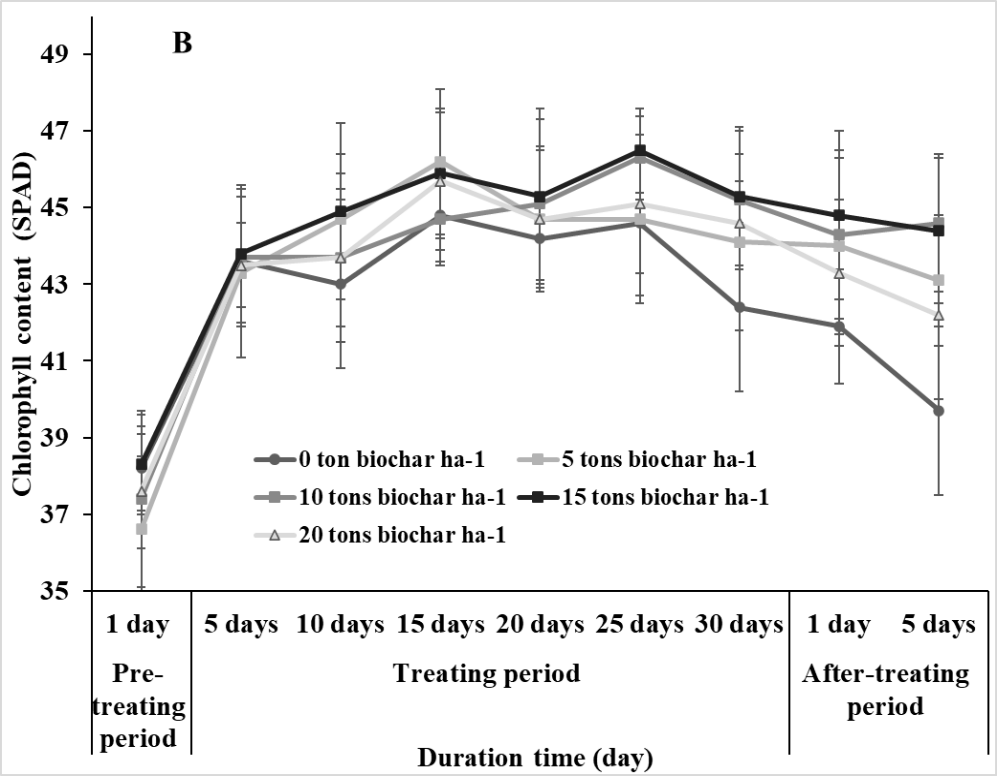
Effect of biochar rates on chlorophyll content
The SPAD values in leaves of soybean plants revealed that chlorophyll content ranged from 36.9-38.3 and 36.6-38.3 at the pre-treating period for the non-salt stress and salt stress conditions, respectively, indicating no significant differences.
SPAD values increased and finally reached 47-48 in the non-salt condition while these values increased until 25th day of the salt stress treatment and then decreased at the end of the treating period and after-treating period. However, SPAD values did not significantly vary in plants at 5, 10, 15, and 20 tons biochar ha-1 (Fig. 2).
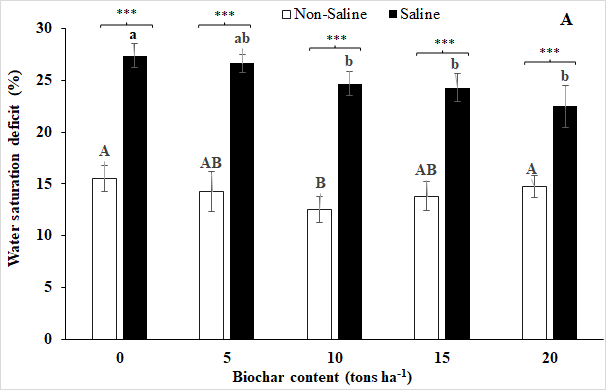
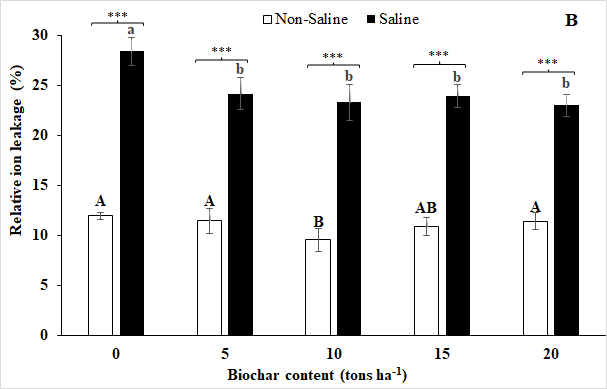
Effect of biochar on water saturation deficit and relative ion leakage
The results from this study revealed that the saline condition increased water saturation deficit and relative ion leakage in soybean leaves while biochar application decreased them (Fig 3). Under the saline treatment, the use of 20 tons of biochar ha-1 has resulted in the lowest values of both water saturation deficit and relative ion leakage in leaves. However, these were not significantly different with values recorded in plants under 5, 10, and 15 tons of biochar ha-1.
Under the non-salt stress condition, the lowest values of water saturation deficit and relative ion leakage were recorded for the biochar treatment of 10 tons ha-1, and the highest values were observed in plants growing in 0 tons ha-1 of biochar treatment under salt stress. However, no significant difference in either water saturation deficit or relative ion leakage was noted among the plants treated with 10 and 15 tons of biochar ha-1 (Fig. 3).
Effect of biochar on nodule number, nodule mass of soybean
Biochar significantly affected nodule number and nodule mass (p ≤ 0.05) in the saline stress condition. The nodule number and nodule mass were significantly reduced under the saline condition while the application of biochar increased nodule number and nodule mass. The lowest values of nodule number and nodule mass were recorded in the untreated soil (without biochar) under both non-salt stress and salt stress conditions. The highest values of nodule number and nodule mass were observed in plants grown in 10 tons ha-1 of biochar treatment under both non-salt stress and salt stress conditions. However, there were no significant differences in nodule number and nodule mass between biochar treatments of 10 and 15 tons ha-1 under both non-salt stress and salt stress conditions (Table 3).
Table 2. Fresh and dry biomasses of roots, shoots and leaves of soybean in response to different rates (0, 5, 10, 15, and 20 tons ha-1) of biochar under non-salt stress and salt stress.
| Treating condition | Biochar rate (tons ha-1) |
Fresh weight (g plant-1) | Dry weight (g plant-1) | ||||
|---|---|---|---|---|---|---|---|
| Root | Shoot | Leaf | Root | Shoot | Leaf | ||
| Non-salt stress | 0 | 2.83 b | 3.52 b | 2.37 cd | 0.78 e | 1.20 b | 0.59 d |
| 5 | 3.09 ab | 3.91 b | 2.95 bc | 0.84 d | 1.25 ab | 0.62 cd | |
| 10 | 3.52 a | 4.53 a | 4.27 a | 1.20 a | 1.35 a | 0.80 a | |
| 15 | 3.49 ab | 4.48 ab | 3.68 ab | 1.17 a | 1.31 a | 0.72 b | |
| 20 | 3.47 ab | 4.16 ab | 3.55 b | 1.10 b | 1.28 ab | 0.64 cd | |
| Salt stress | 0 | 2.72 b | 2.12 c | 1.98 d | 0.63 g | 0.76 d | 0.36 g |
| 5 | 2.85 b | 2.22 c | 2.10 cd | 0.71 f | 0.90 c | 0.41 f | |
| 10 | 3.27 ab | 4.19 ab | 2.73 c | 0.92 c | 1.15 b | 0.66 c | |
| 15 | 2.93 ab | 3.59 b | 2.22 cd | 0.73 e | 1.11 b | 0.54 e | |
| 20 | 2.91 b | 3.42 b | 2.19 cd | 0.71 f | 0.99 c | 0.51 e | |
| CV% | 11.2 | 9.4 | 13.5 | 3.9 | 6.3 | 5.6 | |
| LSDBxT 0.05 | 0.60 | 0.57 | 0.64 | 0.05 | 0.1 | 0.04 | |
| Average of treating condition | Non-salt stress | 3.28 A | 4.12 A | 3.36 A | 1.02 A | 1.28 A | 0.67 A |
| Salt stress | 2.93 B | 3.11 B | 2.24 B | 0.74 B | 0.98 B | 0.50 B | |
| LSDT 0.05 | 0.26 | 0.25 | 0.28 | 0.02 | 0.04 | 0.02 | |
| Average of biochar rates | 0 | 2.77 B | 2.82 C | 2,17 C | 0.71 E | 0.98 C | 0.47 E |
| 5 | 2.97 AB | 3.07 C | 2.52 BC | 0.77 D | 1.08 B | 0.52 D | |
| 10 | 3.39 A | 4.36 A | 3.50 A | 1.06 A | 1.25 A | 0.73 A | |
| 15 | 3.21 A | 4.04 AB | 2.95 B | 0.95 B | 1.21 A | 0.63 B | |
| 20 | 3.19 AB | 3.79 B | 2.87 B | 0.90 C | 1.14 AB | 0.58 C | |
| LSDB 0.05 | 0.42 | 0.40 | 0.45 | 0.04 | 0.07 | 0.03 | |
CV: Coefficient of Variation; LSD: Least significant difference; T: Treating conditions (non-salt stress and salt stress); B: Biochar rates. Mean within a column followed by the same lowercase letters are not significantly different among biochar rates and treating conditions at p ≤ 0.05. Mean within a column followed by the same capital letters are not significantly different among biochar rates or not significantly different between treating conditions by Duncan’s multiple range tests at p ≤ 0.05.
 |
 |
|---|
Fig 1. The quantum efficiency of photosystem II (Fv/Fm) of soybean in response to different rates (0, 5, 10, 15, and 20 tons ha-1) of biochar under non-salt (A) and salt (B) stresses. Vertical bars represent ± SD, n = 15.
Effect of biochar on yield and yield component of soybean
Effect of biochar were assessed on the yield and its components in soybean under non-salt stress and salt stress conditions. Pod number, 100 seed weight, and grain yield were determined in response to biochar and saline treatments. In general, salt stress significantly reduced pod number, 100 seed weight, and grain yield of soybean. However, applying biochar improved pod number, 100 seed weight, and grain yield of soybean in both non-salt stress and salt stress conditions. The biochar treatment of 10 tons ha-1 showed the highest values of pod number, 100 seed weight, and grain yield under both non-salt stress and salt stress conditions (Table 4). However, no significant difference was noted in grain yield for different rates of biochar including 5, 10, 15, 20 tons and 10, 15, 20 tons of biochar ha-1, under the non-salt stress and salt stress conditions, respectively.
Discussion
Salinity has become one of the most crucial environmental factors which negatively affected crop productivity worldwide (Shrivastava and Kumar, 2015). Soybean is considered as a salt-sensitive crop (Luo et al., 2005), as shown by its high sensitivity to saline conditions. Here, we showed that salt stress inhibited the growth characteristics of soybean like root length, leaf area, plant fresh and dry weight, nodule number and nodule mass. These results are in alignment with the previous studies which reported that saline conditions reduced the growth of soybean (El Sabagh et al., 2015), and compromised root and shoot growth. In addition, a study of Farhangi-Abriz and Torabian (2018) also revealed that the number of nodules and nodule masses of soybean decreased under saline condition.
Table 3. Nodule number, nodule weight of soybean in response to different rates (0, 5, 10, 15, and 20 tons ha-1) of biochar under non-salt stress and salt stress.
| Treating condition | Biochar rate (tons ha-1) |
Nodule number (Nodules/plant) | Nodule mass (g/plant) |
|---|---|---|---|
| Non-salt stress | 0 | 25.00 b | 1.90 c |
| 5 | 25.25 b | 2.05 b | |
| 10 | 27.50 a | 2.46 a | |
| 15 | 26.75 a | 2.43 a | |
| 20 | 26.00 ab | 2.16 b | |
| Salt stress | 0 | 11.75 e | 1.39 e |
| 5 | 14.50 d | 1.43 e | |
| 10 | 18.00 c | 1.60 d | |
| 15 | 17.75 c | 1.55 de | |
| 20 | 15.25 d | 1.46 e | |
CV% LSDBxT 0.05 |
5.9 1.78 |
5.5 0.14 |
|
| Average of treating condition | Non-salt stress | 26.10 A | 2.20 A |
| Salt stress | 15.45 B | 1.49 B | |
| LSDCT 0.05 | 0.79 | 0.07 | |
| Average of biochar rates | 0 | 18.38 C | 1.65 C |
| 5 | 19.88 B | 1.74 BC | |
| 10 | 22.75 A | 2.03 A | |
| 15 | 22.25 A | 1.99 A | |
| 20 | 20.63 B | 1.81 B | |
| LSDB 0.05 | 1.26 | 0.10 | |
CV: Coefficient of Variation; LSD: Least significant difference; T: Treating conditions (non-salt stress and salt stress); B: Biochar rates. Mean within a column followed by the same lowercase letters are not significantly different among biochar rates and treating conditions at p ≤ 0.05. Mean within a column followed by the same capital letters are not significantly different among biochar rates or not significantly different between treating conditions by Duncan’s multiple range tests at p ≤ 0.05.
 |
 |
|---|
Fig 2. Chlorophyll content of soybean in response to different rates (0, 5, 10, 15, and 20 tons ha-1) of biochar under non-salt (A) and salt (B) stresses. Vertical bars represent ± SD, n = 15.
Saline stress disturbs plant water relations including water potential in the root zone (Hasanuzzaman et al., 2013) causing imbalance in osmotic potential, ionic equilibrium and nutrient up take (Niu et al., 1995). Therefore, in this study, salinity affects the photosynthetical capacity of soybean mainly through a reduction in Fv/Fm value and chlorophyll content, but it heightened the water deficit and relative ion leakage in the leaves. These results are supported by previous studies which reported that the reduction in photosynthesis under salinity attributed to a decrease in chlorophyll content (Jamil et al., 2007) and the activity of photosystem ΙΙ (Ganivea et al., 1998; Netondo et al., 2004). In addition, Reddy and Vora (1986) also showed that salt stress decreased chlorophyll content, which may be attributed to the increased degradation and inhibited the synthesis of pigment.
Our findings revealed the reduction in yield and its components of soybean under the salt stress. This may be a consequence of the poisonous effect caused by increasing in sodium (Na+) and chloride (Cl–) ions, the breakdown of plant ion balance, and a
decrease in nutrient uptake and physiological processes (Levitt, 1980; Yeo and Flowers, 1983; Leopold and Willing, 1984; Marschner, 1995). On the other hand, the high salt concentrations negatively impact soils properties, potentially affecting the degree of legume nodulation (Slattery et al., 2001). All those parameters can be enhanced with the application of biochar in the soil (Jones et al., 2012). For instance, Farhangi-Abriz and Torabian (2017) indicated that biochar could improve plant growth by reducing oxidative stress in plant tissues of bean under salt stress. Therefore, despite the negative effects of salt stress observed in our study, biochar application enhanced plant growth, photosynthetic efficiency, and soybean yield. However, our findings also revealed a decline in growth, yield components, and grain yield at higher biochar application rates (15 and 20 tons ha-1) compared to the optimal rate (10 tons ha⁻¹) under both non-salt stress and salt stress conditions. This may be attributed to an increased drainage at higher biochar application rates, which may promote nutrient leaching and result in nutrient deficiencies which then adversely affect crop growth and photosynthetic capacity (Ngulube et al., 2018).
Table 4. Yield and its component of soybean in response to different rates (0, 5, 10, 15, and 20 tons ha-1) of biochar under non-salt stress and salt stress.
| Treating condition | Biochar rate (tons ha-1) |
Number of pods/plant (pods) |
100 seed weight (g) |
Grain yield (g/plant) |
|---|---|---|---|---|
| Non-salt stress | 0 | 14.60 d | 18.70 bc | 8.52 b |
| 5 | 16.40 c | 19.48 b | 8.84 a | |
| 10 | 19.29 a | 22.10 a | 10.00 a | |
| 15 | 17.86 b | 19.77 b | 9.15 a | |
| 20 | 17.13 bc | 19.60 b | 9.13 a | |
| Salt stress | 0 | 13.57 e | 18.25 c | 7.30 b |
| 5 | 14.17 de | 18.93 bc | 8.37 b | |
| 10 | 18.50 a | 19.70 b | 9.68 a | |
| 15 | 17.43 b | 19.60 b | 9.08 a | |
| 20 | 15.14 d | 19.20 b | 8.70 a | |
| CV% | 8.2 | 4.9 | 7.5 | |
| LSDTxB 0.05 | 0.79 | 1.06 | 1.31 | |
| Average of treating condition | Non-salt stress | 17.06 A | 19.93 A | 9.13 A |
| Salt stress | 15.56 B | 18.93 B | 8.57 B | |
| LSDT 0.05 | 0.38 | 0.95 | 0.52 | |
| Average of biochar rates | 0 | 13.59 E | 17.98 C | 7.78 B |
| 5 | 15.29 D | 19.21 B | 8.61 AB | |
| 10 | 18.89 A | 20.90 A | 9.84 A | |
| 15 | 17.65 B | 19.67 B | 9.12 A | |
| 20 | 16.13 C | 19.40 B | 8.92 A | |
| LSDB 0.05 | 0.56 | 0.75 | 1.12 | |
CV: Coefficient of Variation; LSD: Least significant difference; T: Treating conditions (non-salt stress and salt stress); B: Biochar rates. Mean within a column followed by the same lowercase letters are not significantly different among biochar rates and treating conditions at p ≤ 0.05. Mean within a column followed by the same capital letters are not significantly different among biochar rates or not significantly different between treating conditions by Duncan’s multiple range tests at p ≤ 0.05.
 |
 |
|---|
Fig 3. Water saturation deficit (A) and Relative ion leakage (B) of soybean leaves in response to different rates (0, 5, 10, 15, and 20 tons ha-1) of biochar under non-salt stress and salt stress at final treatment day. Vertical bars represent ± SD, n = 9. The same letters are not significantly different among biochar rates under non-salt stress (capital letters) and salt stress (lowercase letters), respectively, by Duncan’s multiple range tests at p ≤ 0.05.
Overall, all biochar treatments significantly improved plant growth, photosynthetic efficiency, and soybean yield under salt stress conditions.
Materials and methods
Soil condition
DT84 soybean cultivar was obtained from the Industrial Plant Department, Faculty of Agronomy, Vietnam National University of Agriculture (VNUA). Oak wood biochar (imported from Gangwon Charmsoot Company, Gangwon, Korea) with specifications described by Rajapaksha et al. (2019) was used. The biochar had a pH of 10.17, an EC of 2.15 dSm-1, with a total mobile matter content of 31.42%, a fixed matter content of 56.04%. In addition, its dissolved organic carbon content was
recorded with 14.6 mg L-1, ash content was of 5.03% and the content of C, H, N and O were 88.71%, 1.21%, 0.36%, and 9.72%, respectively.
In this experiment, we used the soil collected from the upland crop experimental field of VNUA. The soil had an organic matter of 1.65%, a pH of 6.35, and total content of N, P, and K of 0.09%, 0.18%, and 1.33%, respectively, of which the exchangeable content of these elements was 4.25 mg/100 g, 50.05 mg/100 g, 11.75 mg/100 g.
Experimental design
A pot experiment with a split-plot design was conducted under a greenhouse condition at VNUA. The rate of applied biochar (0, 5, 10, 15 and 20 tons ha-1) was used as the main factor while the treatment condition (salt stress and non-salt stress) was the sub-factor. Under non-salt stress (control), soybean plants were fully irrigated by tap water from sowing until harvest. For the salt stress, plants (2 per pot) were watered with 100 ml of 100 mM NaCl once every 3 days, when reached the flowering stage. The salinity treatment lasted for 30 days with a total of 1000 ml of 100 mM NaCl solution given to each pot. The experiment employed a total of 270 plastic pots. Each pot (26 cm in diameter, 21 cm in height and a surface area of 0.0051 m2) was filled with 5 kg of alluvial soil collected from VNUA. Before sowing the seeds, biochar was mixed with the soil. The detailed amount of applied biochar in each pot were of 0, 26.5, 53.1, 79.6 and 106.1 g (equivalent to 0, 5, 10, 15 and 20 tons ha-1, respectively). One week after germination, each pot was fertilized on a week basis with 100 mL of a modified Hoagland’s nutrient solution following the instructions given in our previous study (Vu et al., 2023).
Growth parameters
Nine plants per each treatment at 5 days after the final treatment day were randomly selected for measurement of plant height (cm) and root length (cm). Root samples were cleaned with tap water. The number of nodules was counted and then collected to measure nodule weight. Plants were also collected to measure fresh biomasses of roots, shoots and leaves, and then dried at 80oC for 72 h to record the dry biomasses of roots, shoots and leaves. Leaf area (cm2) was measured using the LI-3100C Area Meter (LI-COR Inc., USA).
Physiological parameters
Fifteen plants per each treatment were randomly selected to measure the chlorophyll content (SPAD) and max quantum efficiency of photosystem II (Fv/Fm) before, during and after the salinity treatment was applied. SPAD readings were performed at the second fully developed leaf from the shoot apex of the sample plant using a chlorophyll meter (SPAD-502 Plus, Konica, Minolta Sensing Inc., Osaka, Japan), while the Fv/Fm was determined using the OS- 30p portable fluorometer (Opti-Sciences, Hudson, USA). Nine plants per treatment at the final treatment day were randomly selected to determine the water saturation deficit and relative ion leakage in leaves. The relative ion leakage in the leaf of soybean was measured following the instructions given in our previous study (Vu et al., 2023). Water saturation deficit (WSD) was measured following a method described by Slavík (1963) in a 1 cm leaf segment, and calculated as follows:
\(WSD\ (\%) = \frac{FM1 - \ FM0}{FM1 - DM} \times 100\)
With FM1 is the mass of the full water-saturated leaf segment, FM0 and DM are the initial fresh weight and dry weight of the same leaf segment, respectively.
Yield components
Fifteen plants per treatment at harvest were gathered from randomly selected for measurement of yield components including the pods/plant (pods); grain yield/plant (g); 100 seed weight (g).
Statistical analysis
Data was processed by Excel and statistically analyzed using CropStat (v. 7.2). Comparisons among means of data were done using Duncan’s multiple range tests and t-test at p ≤ 0.05.
Conclusions
Salinity stress negatively affected the growth, physiology and yield of soybean. Biochar application to the soil at rates of 10 tons ha-1 significantly increased root length, leaf area, fresh and dry plant, and nodule number, Fv/Fm, the chlorophyll content and grain yield. Additionally, the biochar application rate with 10 tons ha-1 decreased the water saturation deficit and the relative ion leakage in the leaves. The outcomes of the current study suggest that biochar application at 10 tons ha-1 could be recommended as the optimal dose for soybean in saline-affected soil.
References
Akhtar SS, Li G, Andersen MN, Liu F (2014) Biochar enhances yield and quality of tomato under reduced irrigation. Agric. Water Manag. 138:37-44.
Akhtar SS, Andersen MN, Liu F (2015) Residual effects of biochar on improving growth, physiology and yield of wheat under salt stress. Agric. Water Manag. 158:61-68.
Ali S, Rizwan M, Qayyum MF, Ok YS, Ibrahim M, Riaz M, Arif MS, Hafeez F, AlWabel MI, Shahzad AN (2017) Biochar soil amendment on alleviation of drought and salt stress in plants: a critical review. Environ. Sci. Pollut. Res. 24:12700-12712.
Amini S, Ghadiri H, Chen C, Marschner P (2016) Salt-affected soils, reclamation, carbon dynamics, and biochar: a review. J. Soils Sediments. 16:939-953.
Chaganti VN and Crohn DM (2015) Evaluating the relative contribution of physiochemical and biological factors in ameliorating a saline-sodic soil amended with composts and biochar and leached with reclaimed water. Geoderma. 259:45-55.
Chintala R, Mollinedo J, Schumacher TE, Malo DD, Julson JL (2014) Effect of biochar on chemical properties of acidic soil. Arch. Agron. Soil Sci. 60:393-404.
Dagar JC and Minhas PS (2016) Global perspectives on agroforestry for the management of salt-affected soils. In: Dagar J, Minhas P. (eds) Agroforestry for the management of waterlogged saline soils and poor-quality waters. Advances in Agroforestry. 13. Springer, New Delhi.
El Sabagh A, Abd O, Saneoka H, Barutçular C (2015) Comparative physiological study of soybean (Glycine max L.) cultivars under salt stress. Y.Y.U J. Agr. Sci. 25(3):269-284.
Farhangi-Abriz S and Torabian S (2017). Antioxidant enzyme and osmotic adjustment changes in bean seedlings as affected by biochar under salt stress. Ecotox. Environ. Safe. 137:64-70.
Farhangi-Abriz S and Torabian S (2018) Biochar improved nodulation and nitrogen metabolism of soybean under salt stress. Symbiosis. 74:215-223.
Ganivea RA, Allahverdiyev SR, Guseinova NB, Kavakli HI, Nafisi S (1998) Effect of salt stress and synthetic hormone polystimuline K on the photosynthetic activity of cotton (Gossypium hirsutum). Turk. J. Bot. 22:217-221.
Guo B, Sun L, Jiang S, Ren H, Sun R, Wei Z, Hong H, Luan X, Wang J, Wang X, Xu D, Li, W, Guo C, Qiu LJ (2022) Soybean genetic resources contributing to sustainable protein production. Theor. Appl. Genet. 135:4095-4121.
Hamayun M, Khan SA, Khan AL, Shinwari ZK, Hussain J, Sohn E.Y, Kang SM, Kim YH, Khan MA, Lee IJ (2010) Effect of salt stress on growth attributes and endogenous growth hormones of soybean cultivar Hwangkeumkong. Pak. J. Bot. 42(5):3103-3112.
Hasanuzzaman M, Nahar K, Fujita M (2013) Plant response to salt stress and role of exogenous protectants to mitigate salt-induced damages. In: Ahmad P (eds) Ecophysiology and responses of plants under salt stress. Springer New York, NY. pp 25-87.
Huang M, Yang L, Qin H, Jiang L, Zou Y (2013) Quantifying the effect of biochar amendment on soil quality and crop productivity in Chinese rice paddies. Field Crop Res. 154:172-177.
Jamil M, Rehman S, Lee KJ, Kim JM, Kim HS, Rha ES (2007) Salinity reduced growth PS II photochemistry and chlorophyll content in radish. Sci. Agric. 64:1-10.
Jones DL, Rousk J, Edwards-Jones G, DeLuca TH, Murphy DV (2012) Biochar-mediated changes in soil quality and plant growth in a three-year field trial. Soil Biol. Biochem. 45:113-124.
Katerji N, van Hoorn J, Hamdy A, Mastrorilli M (2003) Salinity effect on crop development and yield, analysis of salt tolerance according to several classification methods. Agric. Water Manag. 62:37-66.
Khan MSA, Karim MA, Haque MM, Islam MM, Karim AJMS, Mian MAK (2016) Influence of salt and water stress on growth and yield of soybean genotypes. Pertanika J. Trop. Agric. Sci. 39(2):167-180.
Kim HS, Kim KR, Yang JE, Ok YS, Owens G, Nehls T, Wessolek G, Kim KH (2016) Effect of biochar on reclaimed tidal land soil properties and maize (Zea mays L.) response. Chemosphere. 142:153-159.
Lashari MS, Liu YM, Li LQ, Pan WN, Fu JY, Pan GX, Zheng JF, Zheng JW, Zhang XH, Yu XY (2013) Effects of amendment of biochar–manure compost in conjunction with pyroligneous solution on soil quality and wheat yield of a salt-stressed cropland from central China Great Plain. Field Crop Res. 144:113-118.
Lehmann J and Joseph S (2015) Biochar for environmental management: science, technology and implementation, Second ed. Routledge, New York. 2015.
Leopold A and Willing RP (1984) Evidence of toxicity effects of salt on membranes. In: salinity tolerance in plants. John Wiley and Sons, New York, USA, pp. 67-76.
Levitt J (1980) Responses of plants to environmental stresses. 2nd edn. Academic Press, New York, 607 pp.
Luo Q, Yu B, Liu Y (2005) Differential sensitivity to chloride and sodium ions in seedlings of Glycine max and G. soja under NaCl stress. J. Plant Physiol. 162(9):1003-1012.
Marschner H (1995) Mineral nutrition of higher plants. Academic Press, London, 889 pp.
Netondo GW, Onyango JC, Beck E (2004) Sorghum and salinity: II. Gas exchange and chlorophyll fluorescence of sorghum under salt stress. Crop Sci. 44:806-811.
Ngulube M, Mweetwa AM, Phiri E, Njoroge SCM, Chalwe H, Shitumbanuma V, Brandenburg RL (2018) Effects of biochar and gypsum soil amendments on groundnut (Arachis hypogaea L.) dry matter yield and selected soil properties under water stress. Afr. J. Agric. Res. 13:1080-1090.
Niu X, Bressan RA, Hasegwa PM, Pardo JM (1995) Ion homeostatis in NaCl stress environments. Plant Physiol. 109:735-742.
Qadir M, Quillérou E, Nangia V, Murtaza G, Singh M, Thomas RJ, Drechsel P, Noble AD (2014) Economics of salt-induced land degradation and restoration. Nat. Resour. Forum. 38:282-295.
Rajapaksha AU, Ok YS, El-Naggar A, Kim H, Song F, Kang S, Tsang YF (2019) Dissolved organic matter characterization of biochars produced from different feedstock materials. J. Environ. Manage. 233:393-399.
Reddy MP and Vora AB (1986) Changes in pigment composition, hill reaction activity and saccharides metabolism in bajra (Pennisetum typhoides S&H) leaves under NaCl salinity. Photosynthetica. 20:50-55.
Saifullah, Dahlawi S, Naeemc A, Rengel Z, Naidu R (2018) Biochar application for the remediation of salt-affected soils: Challenges and opportunities. Sci. Total Environ. 625:320-335.
Shahid SA, Zaman M, Heng L (2018) Soil salinity: Historical perspectives and a world overview of the problem. In: Guideline for salinity assessment, mitigation and adaptation using nuclear and related techniques. Springer, Cham.
Shrivastava P and Kumar R (2015) Soil salinity: A serious environmental issue and plant growth promoting bacteria as one of the tools for its alleviation. Saudi J. Biol. Sci. 22(2):123-131.
Slattery JF, Coventry DR, Slattery WJ (2001) Rhizobial ecology as affected by the soil environment. Anim. Prod. Sci. 41:289-298.
Slavík B (1963) Relationship between the osmotic potential of cell sap and the water saturation deficit during the wilting of leaf tissue. Biol. Plant. 5:258-264.
Talib AE and Dawood HAA (2001) Effect of salt stress on the performance of six soybean genotypes. Pakistan Journal of Biological Sciences. 4:175-177.
Thomas SC, Frye S, Gale N, Garmon M, Launchbury R, Machado N, Melamed S, Murray J, Petroff A, Winsborough C (2013) Biochar mitigates negative effects of salt additions on two herbaceous plant species. J. Environ. Manage. 129:62-68.
Vu NT, Bui TK, VuTTH, Nguyen TH, Le TTC,Tran AT, Vu NL, Tran VQ, Tong VG, Nguyen XT, Yang HC, Lee SJ, Kim YH, Bae YH, Hyeon SJ, Dinh TH, Jang DC (2023) Biochar improved sugarcane growthand physiology under salinity stress. Appl. Sci. 13:7708.
Xu CY, Bai SH, Hao Y, Rachaputi RCN, Wang H, Xu Z, Wallace H (2015) Effect of biochar amendment on yield and photosynthesis of peanut on two types of soils. Environ Sci. Pollut. Res. Int. 22(8):6112-25.
Yeo AR and Flowers TJ (1983) Varietal difference in the toxicity of sodium ions in rice leaves. Physiol. Plantarum. 159:189-195.