
ISSN:1835-2707
Aust J Crop Sci. 18(08):493-499 (2024)
https://doi.org/10.21475/ajcs.24.18.08.pne88
Fermentation characteristics of silage of pearl millet (Pennisetum glaucum (L.) R. Brown) cultivars combined with soybean (Glycine max (L.) Merr.) hull
Francismar de Camargo Anchieta Trevisoli1, Paulo Vitor Divino Xavier de Freitas2, Leonardo Guimarães Oliveira1, Daniel Staciarini Corrêa1, Priscila Anchieta Trevisoli4, Reginaldo Nassar Ferreira3, Reginaldo Jacovetti1, Francine Neves Calil5, Carlos de Melo Silva-Neto*6, Aldi Fernandes de Souza França1
1Animal Science Department, Federal University of Goias, Goias, Brazil
2Animal Science Department, State University of Goiás, Goias, Brazil
3Biology Institute II, Federal University of Goias, Goias, Brazil
4Superior school of Agriculture “Luiz de Queiroz”, University of São Paulo, Piracicaba, Brazil
5Federal University of Goiás, Brazil
6Federal Institute of Goiás, Goiás, Brazil
*Corresponding author: carloskoa@gmail.com
ORCID 0000-0001-8624-3836
Abstract
This study examines the fermentation characteristics of silage of pearl millet (Pennisetum glaucum) cultivars (BRS 1501, ADR 500, ADR 8010) harvested at 65 days of vegetative growth with the inclusion of levels of soybean (Glycine max (L.) Merr.) hulls (0, 3, 6 and 10%). Millet was harvested and ensiled in small silo (mini silo) and kept for 30 days. The laid out in a completely randomized design with a 3 × 4 factorial arrangement with three replicates, where the mini silo was considered an experimental unit. Characteristics such as effluent losses, gas losses, dry matter recovery index and silage composition were evaluated. The highest soybean hull inclusion level (10%) resulted in the lowest gas and effluent losses. Silage dry matter recovery did not differ in response to the inclusion of soybean hulls or between cultivars. Silage pH values ranged from 4.07 to 4.85. Mean buffering capacity ranged from 10.82 (ADR 8010) to 30.19 (ADR 8010) mEq NaOH/100 g DM among treatments. Mean soluble carbohydrate content differed according to the soybean hull inclusion levels and cultivars. Lactic acid content was influenced by the soybean hull inclusion levels, ranging from 5.07% (ADR 8010; at 10% inclusion) to 7.10% (BRS 1501; in control treatment). The inclusion of soybean hulls in the silage of pearl millet cultivars promoted the production of good-quality silage with lower gas and effluent losses. Therefore, the maximum recommended level to include is 10%.
Keywords: Ammoniacal nitrogen, buffering capacity, conservation, pH, organic acid.
Introduction
Silage, the feed produced from anaerobic fermentation, is very important for the preservation of forage plants to be used as feed in periods of forage shortage in tropical regions, which are affected by production seasonality during the dry season (Andriarimalala et al., 2019).
Ensiling is a complex process that involves several microorganisms of different species and genera and their interrelationships. This forage preservation method is based on the conversion of soluble carbohydrates into organic acids such as lactic, butyric, propionic and acetic acids, and the production of each of them is related to the species and genus of microorganisms that predominate during the fermentation process (Bernardes et al., 2018).
Maize and sorghum are considered “standard” silage crops due to their ideal characteristics for silage production, e.g., dry matter (DM) contents between 30 and 35%, water-soluble carbohydrate contents above 13%, as well as low buffering capacity (Caetano et al., 2011). According to Neres et al. (2014), other tropical grasses do not have adequate DM or soluble-carbohydrate contents to allow an efficient fermentation process, resulting in losses from secondary fermentation, effluent production and aerobic deteriorations, which ultimately compromise silage production. Nonetheless, the high buffering capacity of these grasses prevents the pH from dropping to adequate values, allowing the development of spoilage microorganisms, mainly bacteria of the genus Clostridium. These bacteria, in turn, produce ammonia nitrogen and butyric acid, which are detrimental to the preservation process, resulting in high losses of DM and energy from the ensiled material (Bernardes et al., 2018).
Despite its limitations for silage production, pearl millet (Pennisetum glaucum (L.) R. Brown) stands out among tropical grasses due to its adaptability to the most diverse types of soil, satisfactory nutritional value and good biomass production capacity (Silva et al., 2020). In this context, soybean (Glycine max (L.) Merr.) hulls represent an alternative absorbent additive to be included in the ensiling of non-standard tropical forage grasses to circumvent these limitations.
Despite their high cell wall content (over 70%), the high rumen degradability of soybean hulls allow them to partially replace energy feedstuffs and roughages in ruminant diets (Valadares Filho et al., 2010). In addition, the high nutritional value, approximate chemical composition of 90.3% DM and 12.4% crude protein and high moisture-absorption capacity of soybean hulls make this by-product also a good option for use as a moisture-absorbing additive for ensiled materials with a low DM content.
In view of the above considerations, this study was undertaken to examine the fermentation characteristics of silage of three cultivars of pearl millet with the inclusion of soybean hulls.
Results
Effluent losses and dry matter recovery index
Soybean hulls showed a five-fold DM content than pearl millet. However, the soluble carbohydrate contents of both ingredients were very similar (Table 1). Cultivar ADR500 exhibited the highest effluent losses when no soybean hulls were added to the ensiled mass. However, when soybean hulls were included in the silage, this cultivar also showed the greatest reduction in effluent losses (Table 2). Dry matter recovery index was not influenced by any of the evaluated factors.
Gas production and fermentation profile
Gas production was influenced by the interaction between soybean hull inclusion levels and pearl millet cultivars, ranging from 2.43 to 4.87%. The mean content of ammonia nitrogen relative to total nitrogen (N-NH3/TN) determined in the pearl millet silages at the end of 30 days of fermentation differed (p < 0.05) according to the soybean hull inclusion levels and between cultivars, ranging from 3.08% (BRS 1501) to 7.18% (ADR 8010), both values found in control treatment. The mean soluble carbohydrate content also differed (p <0.05) between the inclusion levels and between cultivars, ranging from 5.17% (ADR 500) to 9.73% (BRS 1501), at the soybean hull inclusion level of 10%. Lactic and propionic acid contents were only significantly influenced (p < 0.05) by the soybean hull inclusion levels (Table 3).
Among the evaluated cultivars, ADR500 and BRS1510 showed the lowest gas losses when 10% soybean hulls were included in the ensiled mass. However, gas losses differed between each cultivar (Figure 1).
Cultivars ADR 500 and BRS 1501 showed increasing pH values (Figure 2), unlike cultivar ADR 8010, whose pH decreased slightly with the increasing soybean hull inclusion levels. However, cultivar ADR 8010 exhibited the highest mean pH values among the evaluated cultivars. This result may be associated with the buffering capacity of this cultivar, which decreased as the inclusion levels were elevated.
Buffering capacity differed significantly (p < 0.05) between pearl millet cultivars ADR 500 and ADR 8010 (25.04 vs. 17.38 Eqm NaOH 100 g DM, respectively). In cultivar BRS 1501, the highest buffering capacity values were observed between the soybean hull inclusion levels of 2 and 4%, which decreased as the inclusion levels were raised. In cultivar ADR 500, buffering capacity increased with the soybean hull levels. In cultivar ADR 8010, the lowest buffering capacity value was found between the inclusion levels of 6 and 10% (Figure 3).
The increasing levels of soybean hulls added in the ensiling process caused the lactic acid content of the silage to decrease from 7.10 to 5.07%. This response is in agreement with the pH results, which overall increased with the levels of soybean hulls included in the ensiled forage mass. As a consequence, higher amounts of lactic acid were required to maintain the pH values until the end of the fermentation process (Figure 4).
Discussion
Losses occurring during ensiling and fermentation are difficult to measure and are correlated with the microorganisms involved in the fermentation process as well as with fermentable substrates (Bernardes et al., 2018). Thus, factors such as adequate compaction density, supply of soluble carbohydrates and adequate moisture content of the ensiled material (achieved with the inclusion of moisture scavengers) favor the action of lactic acid-producing bacteria, resulting in reduced gas losses (Yitbarek and Tamir, 2014; Trevisoli et al., 2017). The gas loss values observed in this study were higher than the 1.77 to 7.35 kg/t fresh matter reported by Rezende et al. (2008) in elephant grass silage with 7% inclusion of various absorbent additives. In their experiment, control silage, which included no additives, showed a DM content of 23.76% and an effluent loss of 24.89 kg/t fresh matter.
The gas losses observed in the present study were lower than the 4.63 to 7.38% described by Pinho et al. (2013) in silages of pearl millet harvested at 48 days in the semi-arid region of Brazil. Those authors found silage DM contents that varied between 17.95 and 22.73%. On the other hand, Silva et al. (2012) evaluated the inclusion of crushed maize cob and straw (CMCS) in the silage of three pearl millet cultivars and obtained similar gas loss values, which ranged from 6.10 to 3.48%, demonstrating the efficiency of the additive.
Effluent losses are influenced by factors such as forage DM content, type of ensiled material and compaction density, but the most important of these is the DM percentage of the forage plant to be ensiled. In forages with low DM contents, effluent losses may exceed 10%, whereas less effluent is produced in crops ensiled with DM contents between 31 and 35% (McDonald, 1981).
Despite the observed high coefficients of variation, in mean values, the effluent losses found in this study were lowest in the silages with 10% soybean hull inclusion, confirming the ability of soybean hulls to increase the DM content and reduce effluent losses in the silage. Silva et al. (2012) evaluated the inclusion of CMCS in the production of silage of pearl millet cultivars and obtained effluent losses of 17.28 to 9.05 kg/t of silage, which agrees with the results obtained in the present study.
The DM recovery indices determined in this study were similar to the 94.5% found by Andrade et al. (2010) in elephant grass silages with 10% inclusion of agricultural by-products. According to McDonald (1981), the pH of well-preserved silages ranges between 3.8 and 4.2. However, higher pH values (above 5.0) have been commonly reported in silages of tropical forages, especially in grasses with low soluble carbohydrate contents and high buffering capacity. The pH values found in the present study ranged from 4.07 to 4.85, which are slightly higher values than those recommended for maize and sorghum; the 3.87 found by Costa et al. (2012) in millet ensiled at 65 days of vegetative growth; and the 3.93 observed by Monteiro et al. (2011) in elephant grass silages with inclusion of soybean hulls. Silva et al. (2012) evaluated the inclusion of CMCS in pearl millet silage and observed pH values that ranged from 3.67 to 3.92. The lower pH values found in the current study can be explained by the higher soluble carbohydrate content of CMCS, which results in increased lactic acid production and, consequently, a greater pH decline. The observed pH values may also be related to the increased buffering capacity of the raw material in response to the increasing levels of soybean hulls, whose composition includes organic acids such as malic, citric, phosphoric, and glyceric acids, which contribute to increasing buffering capacity.
Buffering capacity refers to the ability of forage components to resist pH decline, which may prolong the fermentation process and give the opportunity for bacteria (e.g., enterobacteria and clostridia) to develop, thereby promoting undesirable fermentation and the production of acetic and butyric acids, mainly. The buffering capacity values determined in this study are similar to the 22.20 to 17.60 meq NaOH/100 g DM found by Silva et al. (2012) in millet silage with the inclusion of CMCS. Each cultivar exhibited a different behavior according to the soybean hull inclusion levels, which is likely due physiological characteristics of each genotype.
Only cultivar ADR 500 showed increasing ammonia nitrogen values in response to the increasing soybean hull inclusion levels. However, these values did not exceed the maximum limit of 8% (NH3-N/TN) established by Henderson (1993) for silage to be considered of good quality. Similar values were found by Monteiro et al. (2011), who observed a NH3-N/TN percentage of 3.80% in elephant grass silages with inclusion of 10% soybean hulls. In contrast, Silva et al. (2012) evaluated the inclusion of CMCS in millet silage and reported NH3-N/TN percentages of 3.31 to 4.72%, demonstrating the efficiency of this type of additive for non-standard forage.
The increase in the soluble carbohydrate content at the end of the fermentation process may be due to enzymatic action or the acid hydrolysis of hemicellulose, which releases soluble carbohydrates for fermentation. During the stable phase of fermentation, hemicellulose may undergo chemical lysis, releasing sugars for fermentation (Bolsenm et al., 1996). According to Winters et al. (1987), during the early ensiling period, a small amount of nutrients is available for fermentation to take place. These can be converted to organic acids, which cause the rupture of mesophyll cell membranes, releasing nutrients for fermentation. It is also possible that, in anaerobic conditions, the action of auto-catalytic enzymes of plant cells contributes to the disruption of the cellular structure, reducing the availability of nutrients for fermentation. According to the same authors, it is probable that both mechanisms act on the disruption of the cellular structure due to the complexity of the fermentation occurring in the ensiling process.
The mean lactic acid contents determined in this study are close to the 4.82 to 6.86% found by Guimarães Júnior et al. (2005) in silages of three millet cultivars at 28 days of fermentation. This range, in turn, is higher than the 1.4 to 2.4% observed by Hassanat et al. (2007) in millet silages ensiled at 45 days of vegetative growth with and without inoculants based on homofermentative bacteria. Conversely, lower lactic acid values (1.74 to 1.96%) were reported by Silva et al. (2012), who examined the inclusion of CMCS in forage millet silage and obtained lactic acid values consistent with the quality of the silage.
The acetic acid contents obtained in the current study were within the range of 0.5–6.3% described by Yan and Agnew (2004) in an experiment evaluating 136 temperate-grass silages. The acetic acid content is inversely related to the rate of pH decline in silages. Acetic acid is produced mainly from the prolonged action of enterobacteria, heterofermentative lactic bacteria and, to a lesser extent, the action of clostridia. In addition to negatively affecting the pH decline, fermentations promoted by these microorganisms lead to higher DM and energy losses from the ensiled material (Fahey et al., 1994). Therefore, to be considered well-preserved, silage must have a low acetic acid content. According to Tomich et al. (2003), this variable can be used as a parameter to evaluate the quality of the fermentation process and should be less than or equal to 2.5%.
Clostridial proliferation negatively affects silage quality due to butyric acid production, which limits voluntary intake by animals. Low butyric acid concentrations indicate that clostridial activity during fermentation was not sufficient to generate significant losses. Nevertheless, despite the small linear increase in the levels of these acids, all organic acid and volatile fatty acid values were within the expected range even for well-preserved maize silage, e.g., 4 to 6% lactic acid, 2% or less acetic acid and 0.5% butyric acid (McDonald, 1981). The butyric acid contents determined in this study are also in agreement with the 0 to 0.1% recommended by Tomich et al. (2003) for the silage to achieve optimum quality. Silva et al. (2020) evaluated the inclusion of CMCS in the ensiling of three millet cultivars and obtained lower acetic (0.65 to 0.70%), butyric (0.003 to 0.004%) and propionic (0.048 to 0.056%) acid values, which demonstrates the higher efficiency of the additive in fermentation for silage production. It should be noted, however, that the additive used in the present study is the by-product of a legume.
Materials And Methods
Experiment location
The experiment was conducted in the Department of Animal Science, School of Veterinary and Animal Science, Federal University of Goiás (UFG), located in the municipality of Goiânia - GO, Brazil (16º35’00” S, 49º16’00” W, 727 m altitude). The soil of the experimental area is classified as typic dystrophic Red Latosol of clayey texture and medium fertility.
The climate of the region is an Aw type. Climatic data during the experimental period (November and December 2014 to January 2015) obtained from the weather reports of the first-class evaporation station of the Biosystems Engineering Section of the School of Agronomy - UFG, located near the experimental area, revealed the following variations: temperature – 20 to 32 ºC; rainfall per month (mm) – 262.2 to 309.9 mm; insolation – 121.4 to 136.3 h; relative humidity – 76 to 80%.
To characterize the soil in the experimental area, a sample was collected at a depth of 0–0.20 m for physical and chemical analyses, which were performed at the Laboratory of Soil and Leaf Analysis, School of Agronomy, UFG. The following results were obtained: Ca –3.4; Mg – 1.1; H+Al – 2.8; Al – 0.0 and CEC - 7.5 cmol/dm3; P (Mehl) – 3.8 and K – 69 mg/dm3; base saturation – 62.5%; OM – 1.8 %; clay – 35.0 %; sand – 46.0%; and silts – 19.0%.
Implementation of culture
The soil was prepared conventionally, by two harrowing operations: one with a disk harrow and another with a disk plow, before planting. Based on the soil analysis data, no liming was required, in accordance with the recommendations of Martha Júnior et al. (2007).
Sowing was done manually, using 20 pure live seeds (PLS) per linear meter. The plots consisted of five 50 m rows spaced 0.30 m apart, making up a total area of 60 m² for each cultivar. Phosphate and potassium fertilizer were applied using 60 and 30 kg/ha P2O5 (SS) and KCl (KCl), respectively, plus 50 kg/ha FTE BR–16, as recommended by Martha Júnior et al. (2007). The area was top-dressed 20 days after plant emergence using 80 kg/ha de N (urea). During the growing season, cultivation treatments such as weeding were carried out to remove invasive plants from the experimental area.
Harvesting and preparation of mini-silos
The pearl millet cultivars ADR 500, ADR 8010, BRS 1510 were harvested and ensiled on January 23, 2015, at 65 days after seedling emergence. The grass was harvested using a backpack brush cutter at 0.15 m from the ground and then chopped in a forage harvester to particles of approximately 2 cm. Samples were homogenized manually and an aliquot of approximately 1 kg of the chopped material was taken for laboratory analysis and characterization of the plant.
The original material of each cultivar was divided into four equal parts, followed by the inclusion of different levels of soybean hulls, according to the proposed treatments. Experimental silos (small silo or mini-silos) were made from 12 L plastic buckets equipped with Bunsen valves to release the gases produced during the fermentation process. An apparatus consisting of a 2 cm layer of coarse sand and two layers of cotton fabric was placed at the bottom of each mini-silo to collect and measure effluent losses. Before ensiling, the silos were weighed with all apparatuses and lids. Silos were filled manually. A manual hydraulic press was also used to complete the compaction process, aiming at an average density of approximately 545 kg m³. After compaction, the silos were closed, sealed with adhesive tape and weighed.
Analyzed variables
Silos were opened exactly 30 days after ensiling and weighed to determine gas losses by difference from the initial weight. Subsequently, two sub-samples of approximately 500 g of each treatment were collected to analyze the silage mass. After complete removal of the ensiled mass, the experimental silos were weighed with all apparatuses and lids to determine effluent losses and calculate the dry matter recovery index (DMRI). Gas losses (GL), effluent losses (EL) and DMRI were calculated as proposed by Jobim et al. (2007), as follows:
$$GL = \frac{Wcl - Wop}{FMcl - DMcl}x1000$$
where GL = gas losses (% DM); Wcl = weight of the full bucket at the time of closing (kg); Wop = weight of the full bucket at the time of opening (kg); FMcl = forage mass at the time of closing (kg); and DMcl = forage dry matter content at the time of closing (% DM).
$$EL = \frac{Wop - Wcl}{FMcl}\ x\ 1000$$
where Efl = effluent production (kg/t of fresh mass); Wop = weight of the empty set (bucket, lid, sand and cloth) at the time of opening (kg); Wcl = weight of the empty set (bucket, lid, sand and cloth) at the time of closing (kg); and FMcl = forage mass at the time of closing (kg).
$$DMRI = \frac{FMop\ x\ DMop}{FMcl\ x\ DMcl}\ x\ 100$$
where DMRI = dry matter recovery index (%); FMop = forage mass at the time of opening (kg); DMop = forage dry matter content at the time of opening (%); FMcl = forage mass at the time of closing (kg); and DMcl = forage dry matter content at the time of closing (%).
The first sub-sample (approximately 500 g) was dried in a forced-air oven at 65 °C for 72 h to determine the pre-dried matter and ground in a Wiley knife mill (Tecnal - TE680, Piracicaba, Sao Paulo, Brazil) using a 1 mm diameter sieve. The material was then identified and stored in polyethylene containers for chemical analysis. Dry matter, crude protein (CP) and soluble carbohydrate contents were determined according to methods recommended by Detmann et al. (2012).
The second sub-sample was used to extract the silage juice to determine the ammonia nitrogen (NH3-N) content and the content of organic and fatty acids, namely, lactic acid, acetic acid, propionic acid and butyric acid. Ten milliliters of 25% phosphoric acid (w/v) were added to 50 mL of juice and frozen at -17 °C for further analysis of organic and fatty acids. The samples were centrifuged at 13,000 rpm for 15 min and then analyzed in a high-performance liquid chromatograph (HPLC) (SPD–10A VP, Shimadzu®, Kyoto, Japan) coupled to an ultraviolet (UV) detector at a wavelength of 210 nm, through a Biorad C18 (Reverse-Phase) column at 168 kgf pressure and 1.5 mL/min flow, using H2SO4 as the eluent (0.0025 mol L).
Samples for the analysis of NH3-N were preserved in 1 mL of 50% sulfuric acid to 50 mL juice and frozen at -17 °C for further analysis. Buffering capacity was measured, with results expressed in mEq of alkali required to change the pH from 4 to 6 in 100 g of sample DM. The pH and NH3-N values were measured by following the methodology adapted by Silva and Queiroz (2006).
Experimental design and statistical analysis
Treatments consisted of each level of soybean hull (0, 3, 6 and 10%) included in the ensiled mass of three pearl millet cultivars (ADR 8010, ADR 500 and BRS 1501). The experiment was laid out in a completely randomized design with a 3×4 factorial arrangement with three replicates, where the mini-silo was considered an experimental unit. The means of the variables were analyzed by the Shapiro Wilk test, followed by a normal distribution test. Effluent losses, dry matter recovery index, ammonia nitrogen, soluble carbohydrates and lactic, acetic, propionic and butyric acid contents were evaluated by analysis of variance and means were compared by Tukey’s test at the 5% significance level using R software (R Core team, 2015). Gas losses, buffering capacity, pH and lactic acid content were subjected to regression analysis for the soybean hull inclusion levels.
Conclusions
In addition to reducing gas and effluent losses and allowing satisfactory dry matter recovery, the inclusion of soybean hulls in the ensiling of pearl millet as evaluated in this study maintained the pH value and the ammonia nitrogen content within the accepted range for the characterization of good-quality silage. Therefore, this is a viable alternative for the production of preserved forage.
References
Andriarimalala JH, Kpomasse CC, Salgado P, Ralisoa N, Durai J (2019) Nutritional potential of bamboo leaves for feeding dairy cattle. Pesqui. Agropecu. Trop. 49(e54370):1-8.
Andrade IVO, Pires AJV, Carvalho GGP, Veloso CM, Bonomo P (2010) Perdas, características fermentativas e valor nutritivo da silagem de capim-elefante contendo subprodutos agrícolas. Rev. Bras. Zootec. 39(12):2578–2588.
Bernardes TF, Daniel JLP, Adesogan AT, McAllister TA, Drouin P, Nussio, Huhtanen P, Tremblay GF, Bélanger G, Cai, Y (2018) Silage review: Unique challenges of silages made in hot and cold regions. J Dairy Sci. 101(5):4001-4019.
Bolsen KK, Ashbell G, Weinberg ZG (1996) Silage fermentation and silage additives - Review. Asian-australas. J. Anim. Sci. 9:483–494.
Caetano H, Oliveira MDS, Freitas-Júnior JE, Rêgo AC, Rennó FP, Carvalho MV (2011) Evaluation of corn cultivars harvested at two cutting heights for ensilage. Rev Bras Zootec. 40(1):12–19.
Costa KAP, Guerra Filho IA, Assis RL, Guimaraes KC, Cruvinel WS, Epifanio PS, Gouveia RR (2012) Silage quality of pearl millet cultivars produced in different cutting ages. Semin Ciênc Agrar. 33(3):1189–1198.
Detmann E, Souza MA, Valadares Filho SC (2012) Métodos para análise de alimentos. Instituto Nacional de Ciência e Tecnologia de Ciência Animal, 1° ed Editora Independente.
Fahey GC, Rotz CA, Muck RE (1994) Changes in Forage Quality During Harvest and Storage. ASA, CSSA, and SSSA Books.
Guimarães-Júnior R, Gonçalves LC, Rodrigues JAS, Rodriguez NM, Borges ALC, Borges I, Pires DAA (2005) Carboidratos Solúveis, Digestibilidade “In vitro” da Matéria Seca e Ácidos Orgânicos das Silagens de Três Genótipos de Milheto [Pennisetum glaucum (L). R. Br.] em Diferentes Períodos de Fermentação. Rev Bras Milho e Sorgo. 4(1):95–103.
Hassanat F, Mustafa AF, Seguin P (2007) Effects of inoculation on ensiling characteristics, chemical composition and aerobic stability of regular and brown midrib millet silages. Anim Feed Sci. Technol. 139(1-2):125–140.
Henderson, N (1993) Silage additives. Anim Feed Sci Technol. 45(1):35–56.
Jobim CC, Nussio LG, Reis RA, Schmidt P (2007) Avanços metodológicos na avaliação da qualidade da forragem conservada. Rev Bras Zootec. 36:101-119.
Martha Júnior GB, Vilela L, Sousa DMG (2007) Cerrado: uso eficiente de corretivos e fertilizantes em pastagens. Embrapa Cerrados. 224p.
McDonald P (1981) The biochemistry of silage. Chichester: John Wiley and Sons, Ltd. 226p.
Monteiro IJG, Abreu JG, Cabral LS, Ribeiro MD, Reis RHP (2011) Silagem de capim-elefante aditivada com produtos alternativos. Acta Sci Animal Science. 33:347-352.
Neres MA, Hermes PR, Ames JP, Zambom MA, Castagnara DD, Souza LC (2014) Use of additives and pre-wilting in Tifton 85 bermudagrass silage production. Cienc e Agrotecnologia. 38(1):85-93.
Pinho RMA, Santos EM, Rodrigues JAS, Macedo CHO, Campos FS, Ramos JPF, Perazzo AF (2013) Avaliação de genótipos de milheto para silagem no semiárido. Rev Bras de Saúde e Prod Anim. 14(3):426–436.
Rezende AV, Gastaldello-Junior AL, Valeriano AR, Casali AO, Medeiros LT, Rodrigues R (2008) Uso de diferentes aditivos em silagem de capim-elefante. Cienc e Agrotecnologia. 32(1):281-287.
Silva AG, Farias-Júnior OL, França AFS, Miyagi ES, Rios LC, Moraes Filho CG, Ferreira JL (2012) Rendimento forrageiro e composição bromatológica de milheto sob adubação nitrogenada. Ciênc Anim Bras. 13(1):67–75.
Silva DJ, Queiroz ACD (2006) Análise dos alimentos (Métodos químicos e biológicos). MG: Universidade Federal de Viçosa, 3° ed.
Silva NR, Freitas PVDX, Silva Neto CM, Ferreira RN, Oliveira LG, Correa DS, Hellmeister Filho P, Brasil EPF, Freitas IC, França, A. F.S (2020) Biomass, Efficiency of Nitrogen Conversion and Nitrogen Recovery in Millet Cultivars Under Nitrogen Fertilization. J Agric Stud. 8(2):339-351.
Tomich TR, Pereira LGR, Gonçalves LC, Tomich RGP, Borges I (2003) Características químicas para avaliação do processo fermentativo de silagens: uma proposta para qualificação da fermentação. In Documentos p. 20.
Trevisoli FCA, França AFS, Corrêa DS, Trevisoli PA, Oliveira LG (2017) Nutritional composition of silage from pearl millet cultivars with the inclusion of soy hulls. Rev Ciênc Agron. 48(3):540-547.
Valadares Filho SC, Machado PAS, Chizzoti ML, Amaral HFA, Magalhães KA, Junior VR R, Capelle ER (2010) Tabelas Brasileiras de Composição de Alimentos para Bovinos. Editora UFV.
Winters AL, Whittaker PA, Wilson RK (1987) Microscopic and chemical changes during the first 22 days in Italian ryegrass and cocksfoot silages made in laboratory silos. Grass Forage Sci. 42:191–196.
Yan T, Agnew RE (2004) Prediction of nutritive values in grass silages: I. Nutrient digestibility and energy concentrations using nutrient compositions and fermentation characteristics. J Anim Sci. 82(5):1367–1379.
Yitbarek MB, Tamir B (2014) Silage Additives: Review. Open J Appl Sci. 4(5):258–274.
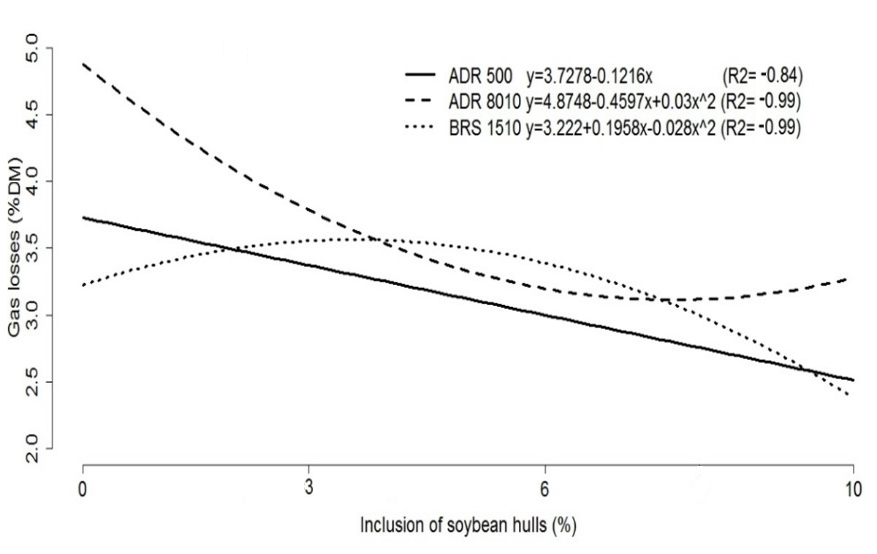
Figure 1. Representative graph of the equations of gas losses % DM in the silages of pearl millet cultivars with levels of inclusion of soybean hulls.
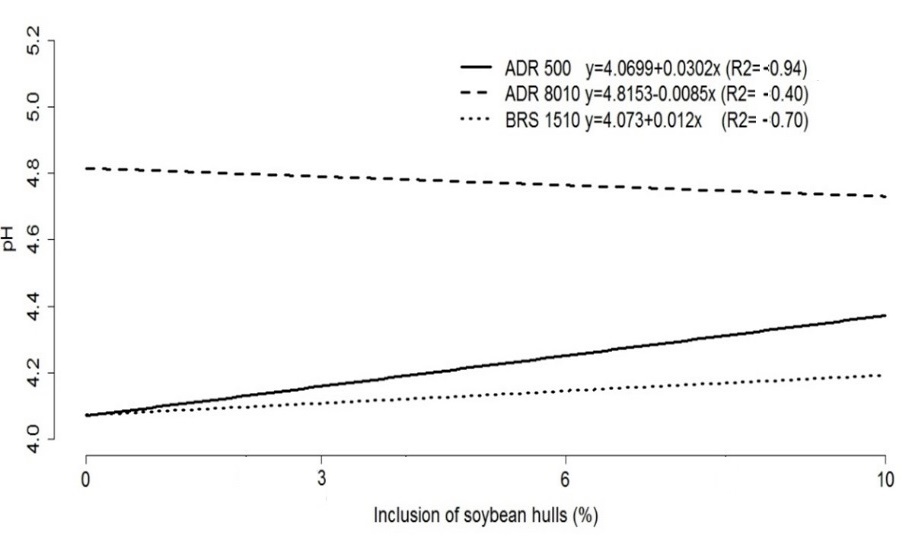
Figure 2. Representative graph of the regression equations of pH values in the silages of pearl millet cultivars with levels of inclusion of soybean hulls.
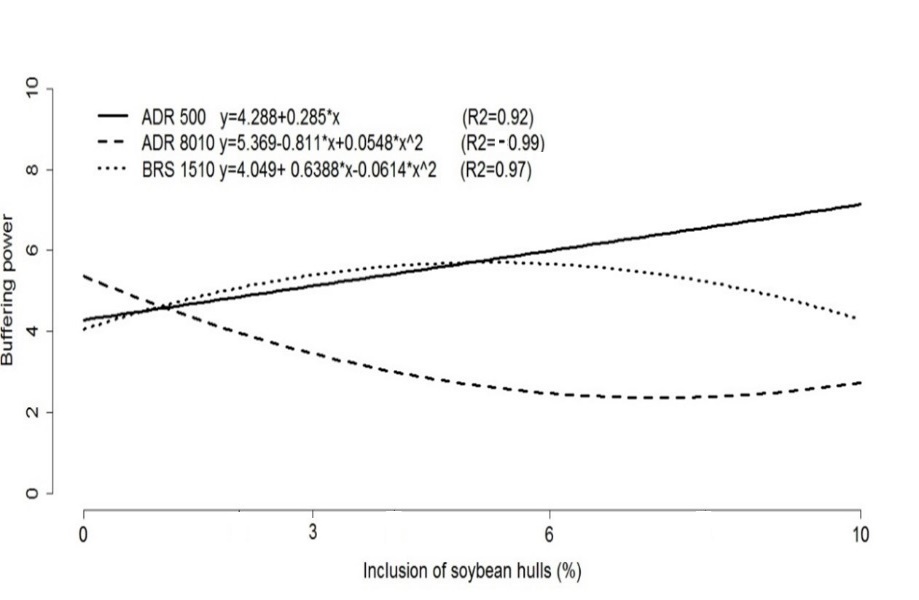
Figure 3. Representative graph of the regression equations of buffering power in the silages of pearl millet cultivars with levels of inclusion of soybean hulls.
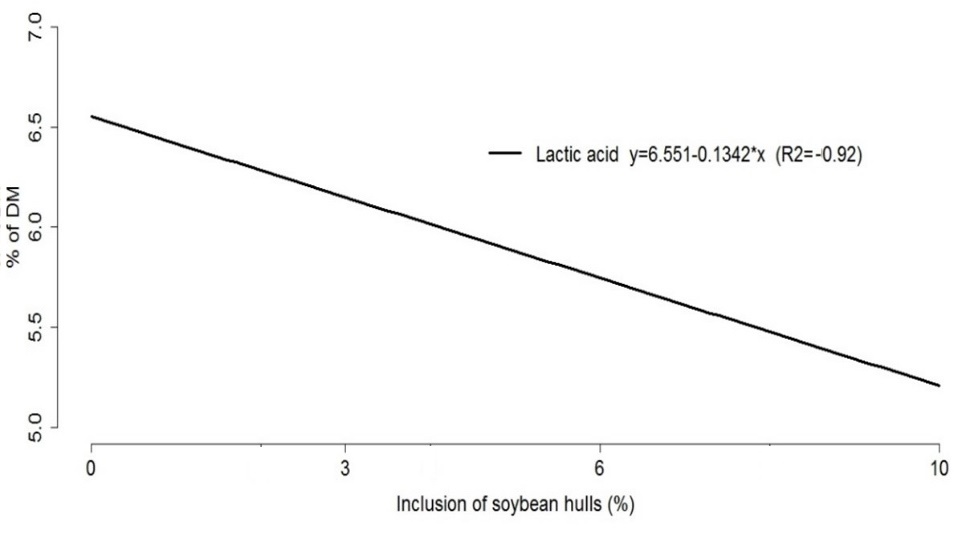
Figure 4. Representative graph of the regression equations of lactic acid values in the silages of pearl millet cultivars with levels of inclusion of soybean hulls.
Table 1. Mean values of dry matter (DM) and soluble carbohydrates (SC) determined in the original matter of pearl millet cultivars and soybean hulls
| BRS 1501 | ADR 500 | ADR 8010 | soybean hulls | |
|---|---|---|---|---|
| DM (%) | 18.31 | 17.79 | 18.23 | 94.47 |
| SC (%) | 7.53 | 7.38 | 8.46 | 9.97 |
Table 2. Mean values of effluent losses (Efl) in kg/t green mass, dry matter recovery index (DMRI (% DM)), ammonia nitrogen (NH3-N (% total N)) and soluble carbohydrates (SC (%)) determined in the silage of pearl millet cultivars with the inclusion of levels of soybean hulls
| Cultivars | Inclusion of soybean hulls (%) | SEM | P Value | ||||||
|---|---|---|---|---|---|---|---|---|---|
| 0 | 3 | 6 | 10 | C | I | C x I | |||
| Efl (%) | BRS 1501 | 13.74Ab | 4.70Aa | 10.44Aa | 9.41Aa | 2.913 | 0.001 | 0.028 | <0.001 |
| ADR 500 | 32.09Aa | 12.55Ba | 10.92Ba | 14.25Ba | |||||
| ADR 8010 | 4.38Ab | 13.21Aa | 14.74Aa | 5.80Aa | |||||
| DMRI (%) | BRS 1501 | 91.51Aa | 93.46Aa | 90.64Aa | 92.99Aa | 1.908 | 0.303 | 0.341 | 0.988 |
| ADR 500 | 93.77Aa | 92.51Aa | 90.14Aa | 92.97Aa | |||||
| ADR 8010 | 94.54Aa | 94.91Aa | 92.49Aa | 94.42Aa | |||||
| NH3-N (% total N) | BRS 1501 | 3.08Ab | 3.50Ab | 3.93Aa | 3.70Ab | 0.424 | <0.001 | 0.278 | 0.007 |
| ADR 500 | 4.04Bb | 3.79Bb | 4.76ABb | 6.15Aa | |||||
| ADR 8010 | 7.18Aa | 6.98Aa | 6.98Aa | 5.93Aa | |||||
| SC (%) | BRS 1501 | 7.72Ba | 8.81ABa | 9.34Aa | 9.73Aa | 0.3306 | <0.001 | <0.001 | 0.194 |
| ADR 500 | 5.17Cb | 6.88Bb | 7.81ABb | 8.78Aa | |||||
| ADR 8010 | 7.10Ba | 8.09ABab | 8.57Aab | 8.91Aa | |||||
Different letters in the row (caps lock) and in the column (lower case) differ statistically from each other by the Tukey test at the 5% probability level (p <0.05). C: Cultivars; I: Inclusion of soybean hulls (%).
Table 3. Mean contents (%) of lactic acid (LA), acetic acid (AcA), propionic acid (PA) and butyric acid (BA) determined in the silage of millet cultivars with soybean hulls
| Cultivars | Inclusion of soybean hulls (%) | SEM | P Value | ||||||
|---|---|---|---|---|---|---|---|---|---|
| 0 | 3 | 6 | 10 | C | I | C x I | |||
| LA | BRS 1501 | 7.10Aa | 6.30Aba | 5.95Ba | 5.61Ba | 0.268 | 0.210 | <.0001 | 0.586 |
| ADR 500 | 6.22Aa | 5.96Aa | 5.63Aa | 5.35Aa | |||||
| ADR 8010 | 6.81Aa | 5.77ABa | 5.18Ba | 5.07Ba | |||||
| AcA | BRS 1501 | 1.22Aa | 1.25Aa | 1.36Aa | 1.23Aa | 0.153 | 0.153 | 0.158 | 0.226 |
| ADR 500 | 1.70Aa | 1.65Aa | 1.20Aa | 1.13Aa | |||||
| ADR 8010 | 1.64Aa | 1.40Aa | 1.57Aa | 1.31Aa | |||||
| PA | BRS 1501 | 0.11Ba | 0.13ABa | 0.14Aa | 0.14Aa | 0.009 | 0.160 | 0.013 | 0.137 |
| ADR 500 | 0.13Aa | 0.14Aa | 0.15Aa | 0.14Aa | |||||
| ADR 8010 | 0.12Aa | 0.11Aa | 0.12Aa | 0.13Aa | |||||
| BA | BRS 1501 | 0.04Aa | 0.03Aa | 0.03Aa | 0.03Aa | 0.003 | 0.832 | 0.300 | 0.673 |
| ADR 500 | 0.04Aa | 0.03Aa | 0.03Aa | 0.03Aa | |||||
| ADR 8010 | 0.04Aa | 0.03Aa | 0.03Aa | 0.03Aa | |||||
Different letters in the row (caps lock) and in the column (lower case) differ statistically from each other by the Tukey test at the 5% probability level (p <0.05). C: Cultivars; I: Inclusion of soybean hulls (%).